Analytics
The Analytics page provides time-series metrics for ingest, transcoding, and delivery activity. All metrics are aggregated in 5-minute intervals and displayed across two tabs: Ingest & Transcoding and Delivery.
Ingest & Transcoding
The Ingest & Transcoding tab displays metrics related to incoming stream activity and active transcoding tasks.
Filters
The following filters are available to narrow the data displayed:
| Filter | Description |
|---|---|
| Region | Filter metrics by geographic region |
| Ingest Domain | Filter by a specific ingest domain |
| App | Filter by application name |
| Stream | Filter by stream name |
| Time Range | Select a time window; defaults to Last 24 hours |
Charts
- Total Bandwidth of Ingest Streams — Displays the aggregate bandwidth consumed by all active ingest streams over the selected time range.
- Number of Concurrent Ingest Streams — Shows the count of streams being ingested simultaneously at each 5-minute interval.
- Total Number of Concurrent Transcoding Tasks — Displays the number of active transcoding tasks running concurrently at each interval.
Use the Stream filter together with a narrowed Time Range to isolate metrics for a single broadcast session and diagnose ingest issues.
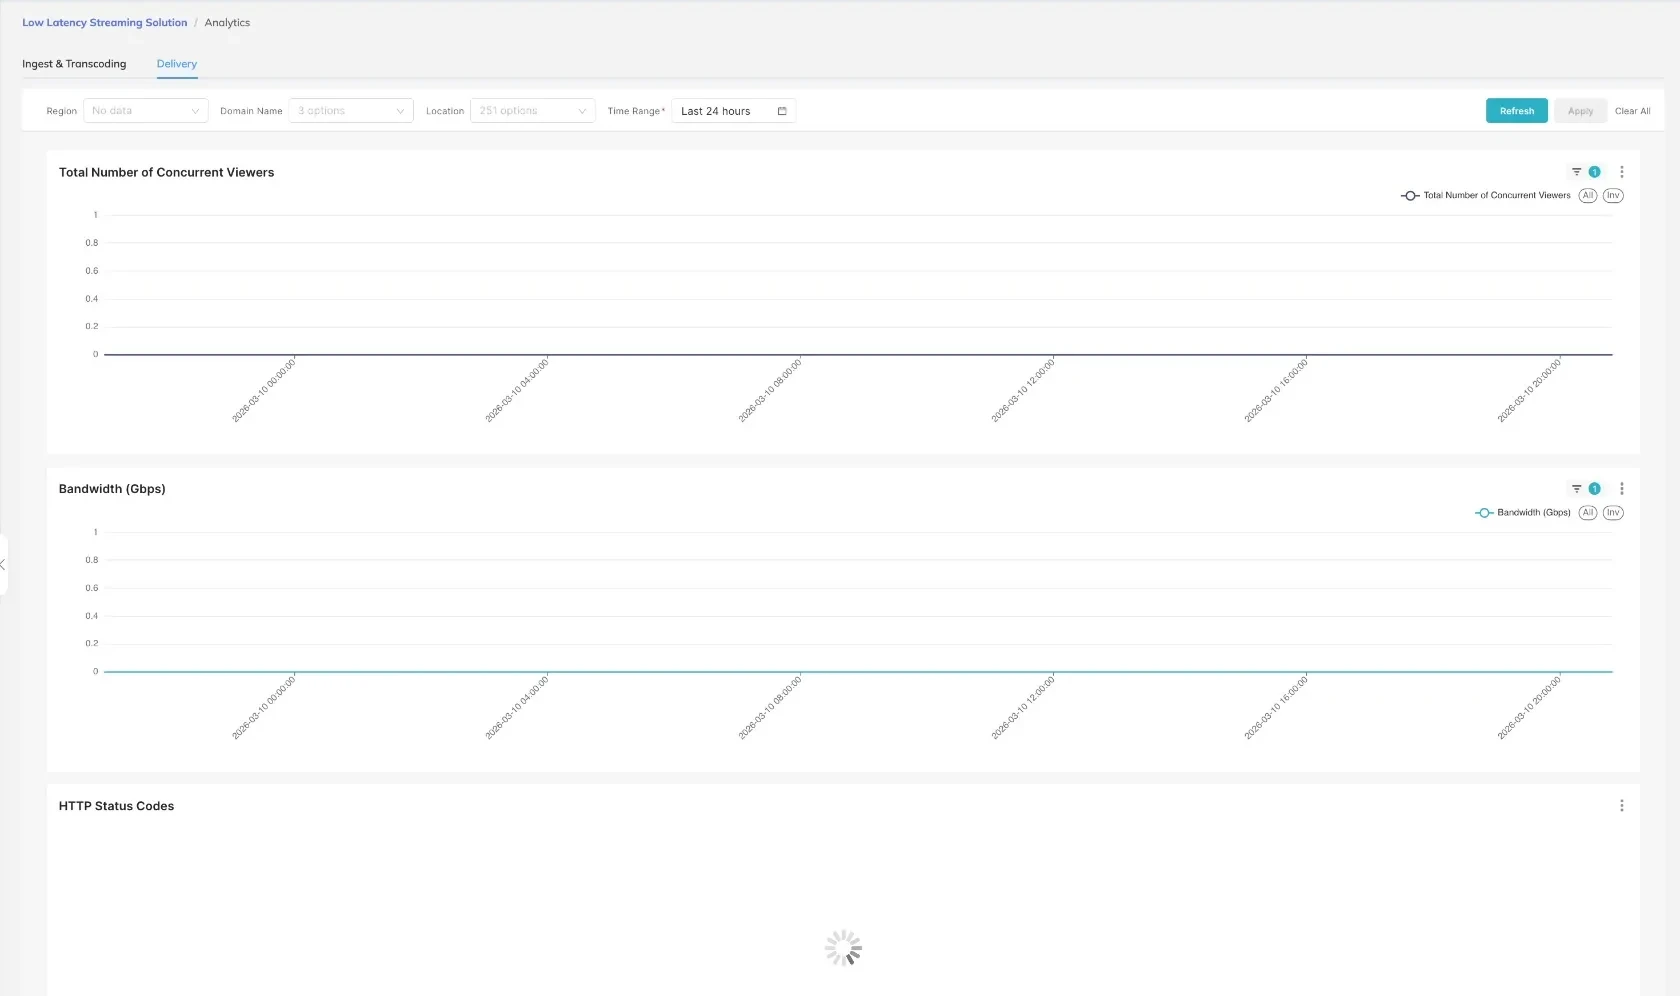
Delivery
The Delivery tab displays metrics related to viewer access and content delivery performance.
Filters
The following filters are available on the Delivery tab:
| Filter | Description |
|---|---|
| Region | Filter metrics by geographic region |
| Domain Name | Select from 3 available delivery domains |
| Location | Filter by viewer location; 251 location options available |
| Time Range | Select a time window for the metrics display |
Charts
- Total Number of Concurrent Viewers — Shows the peak and average number of viewers accessing streams simultaneously at each 5-minute interval.
- Bandwidth (Gbps) — Displays the total outbound delivery bandwidth in gigabits per second over the selected time range.
- HTTP Status Codes — Breaks down HTTP response codes returned to viewers, useful for identifying delivery errors or cache performance issues.
A significant increase in non-2xx HTTP status codes may indicate a misconfigured delivery domain or an issue with the origin stream.