Dashboard
The dashboard in Conversant LSS provides a visualised overview for real-time monitoring and operational insights, enabling quick access to key performance and usage data.
Dashboard Components
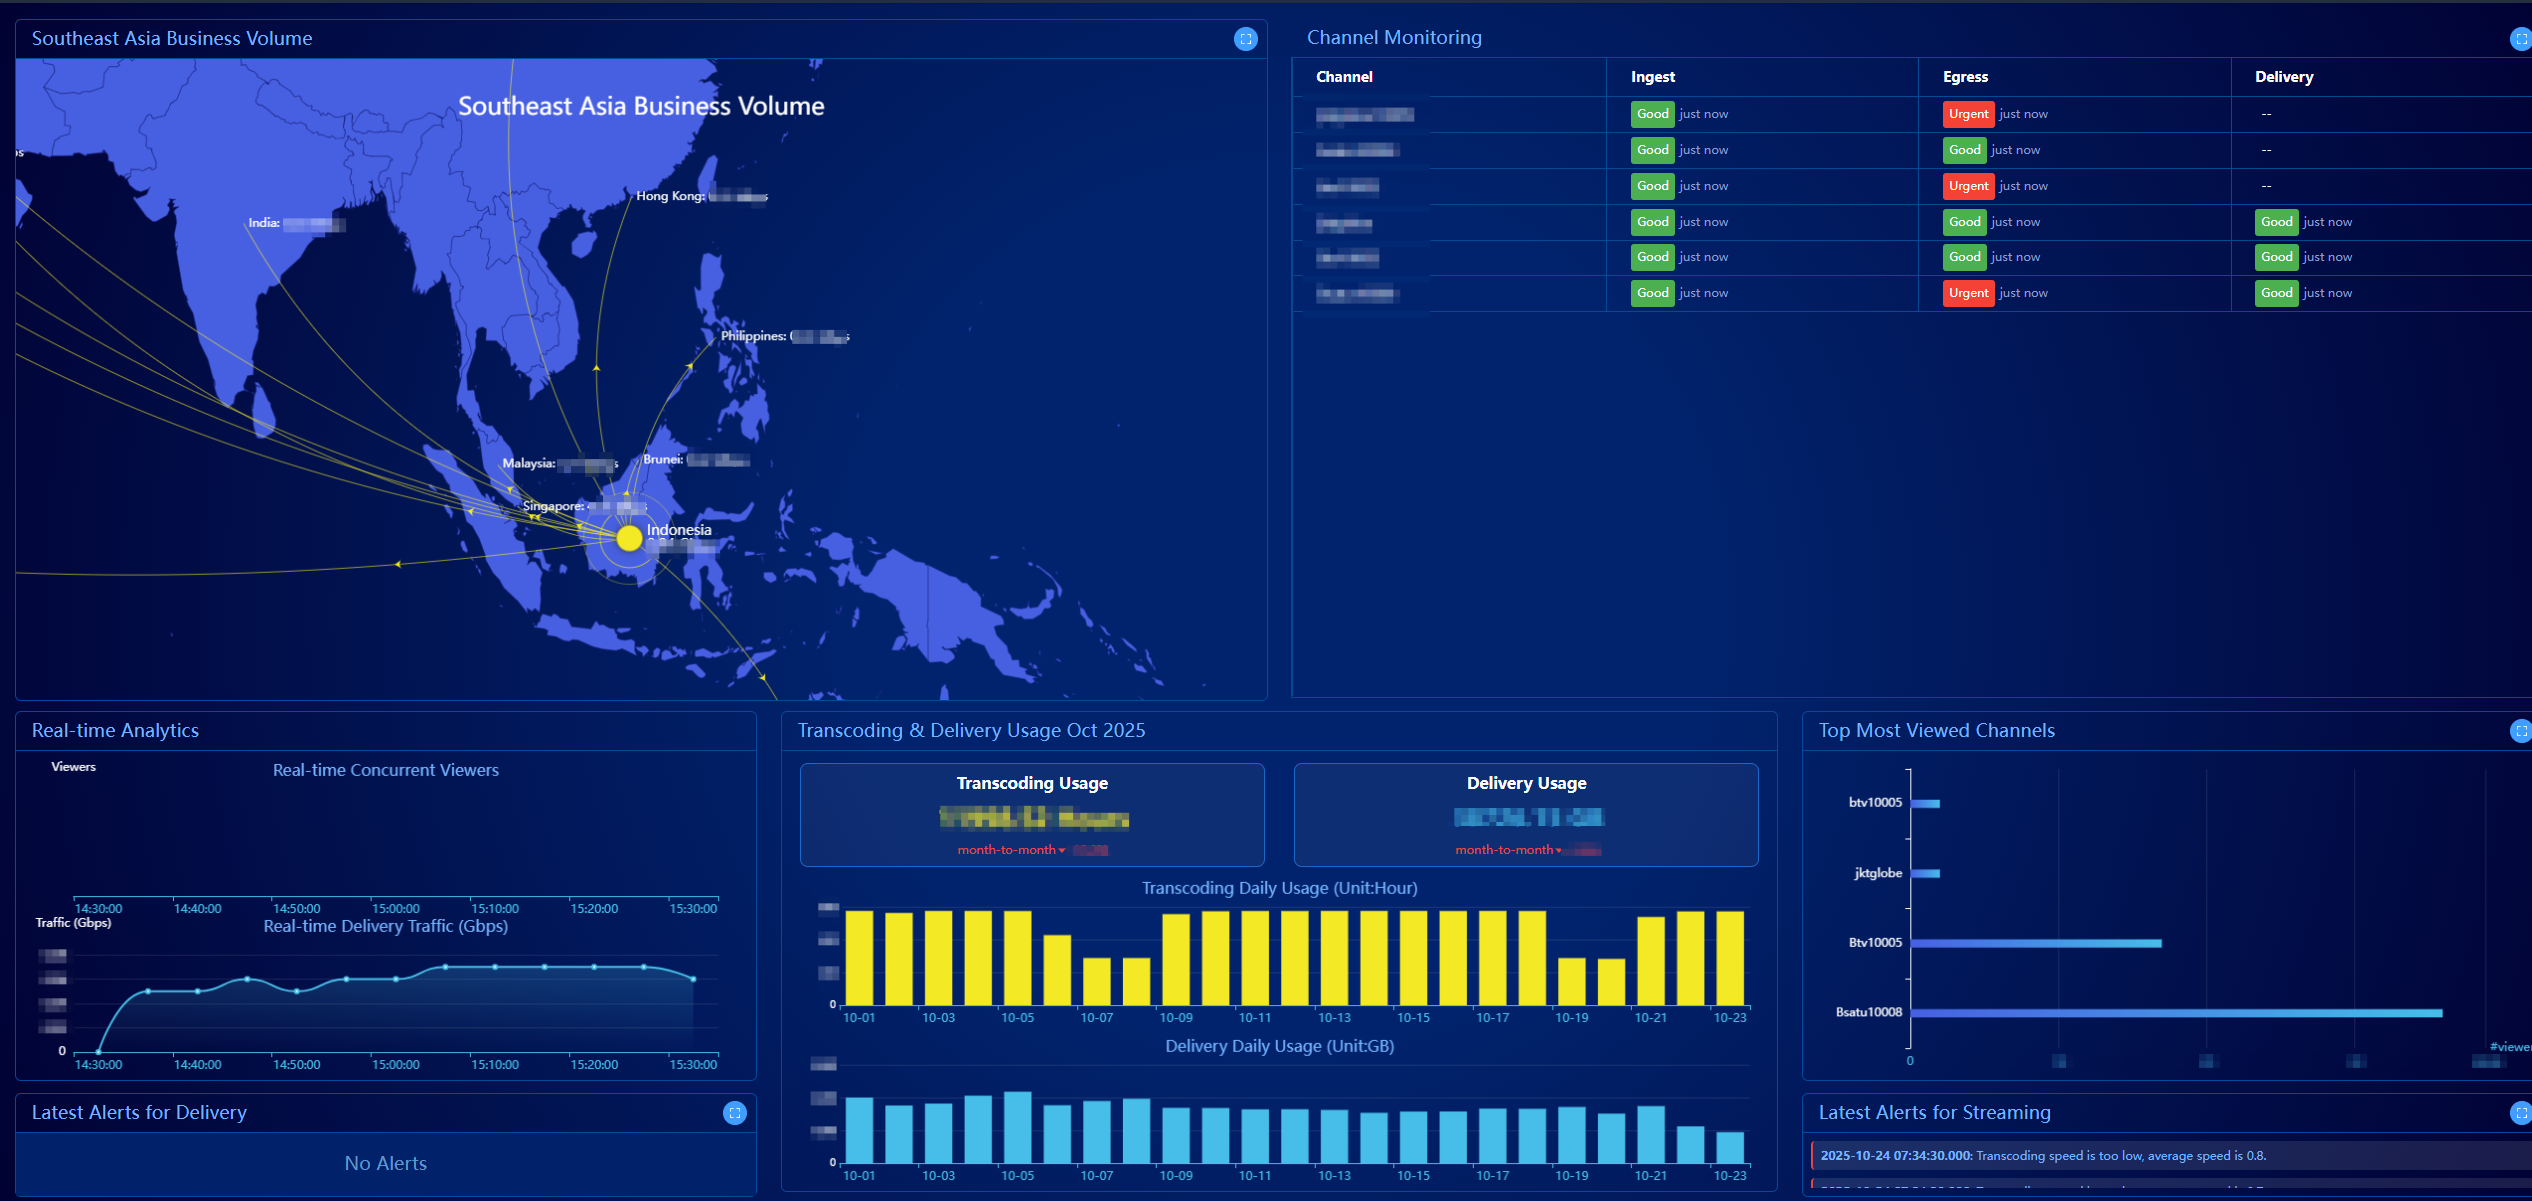
- SEA Delivery Volume - Displays real-time delivery bandwidth across Southeast Asia, with detailed views on country and major cities.
- Channel Monitoring - Refer to the Monitoring section for detailed channel performance and status information.
- Real-time Concurrent Viewer - Shows the peak number of distinct viewers within the past hour. Each unique client IP is counted as one viewer.
- Real-time Delivery Traffic - Displays real-time delivery bandwidth statistics for the last hour.
- Transcoding Usage - Presents this month's total transcoding usage, month-over-month growth rate, and daily transcoding usage trends.
- Delivery Traffic - Displays the current month's total delivery usage, month-over-month growth rate, and daily delivery usage trends.
- Top Most Viewed Channel - Lists the top 5 channels with the highest total viewership for the current month.
- Latest Alert - Shows the latest alerts related to source ingest, media processing, and content delivery environments.