Basic Analytics
Bandwidth and Data Returned Information
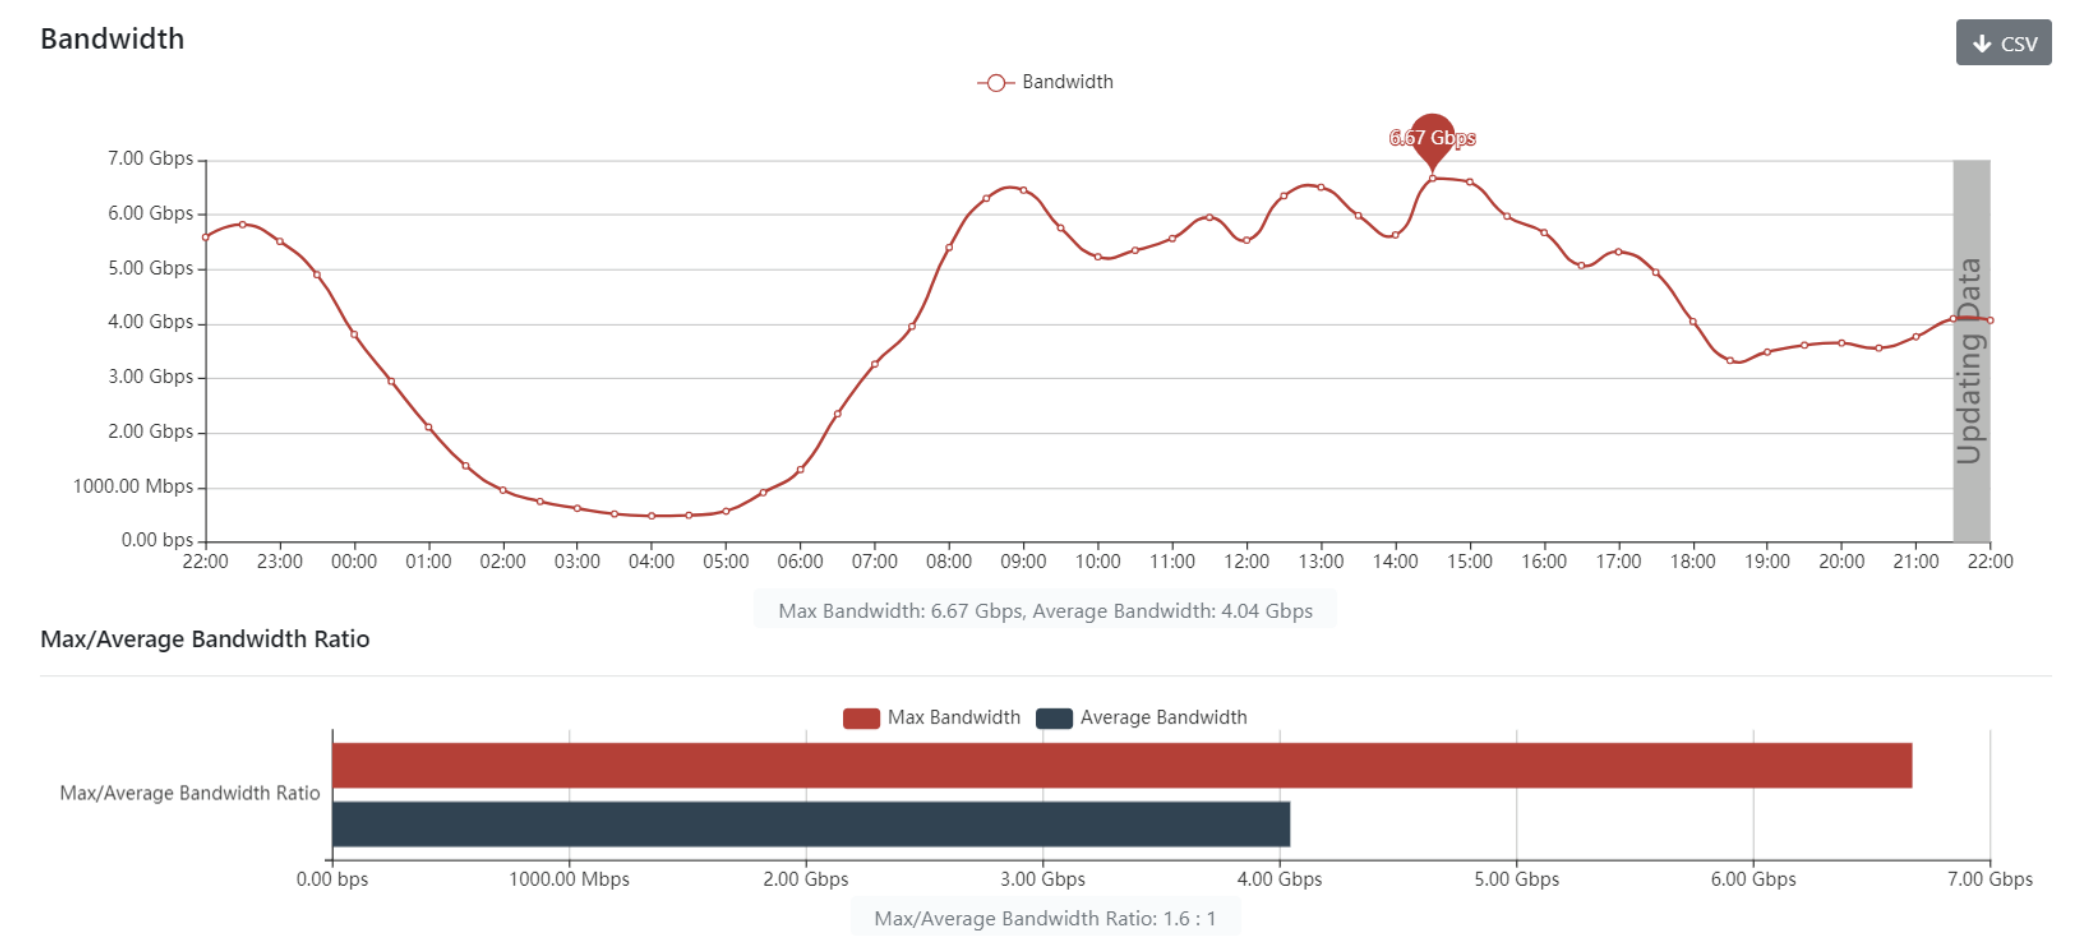
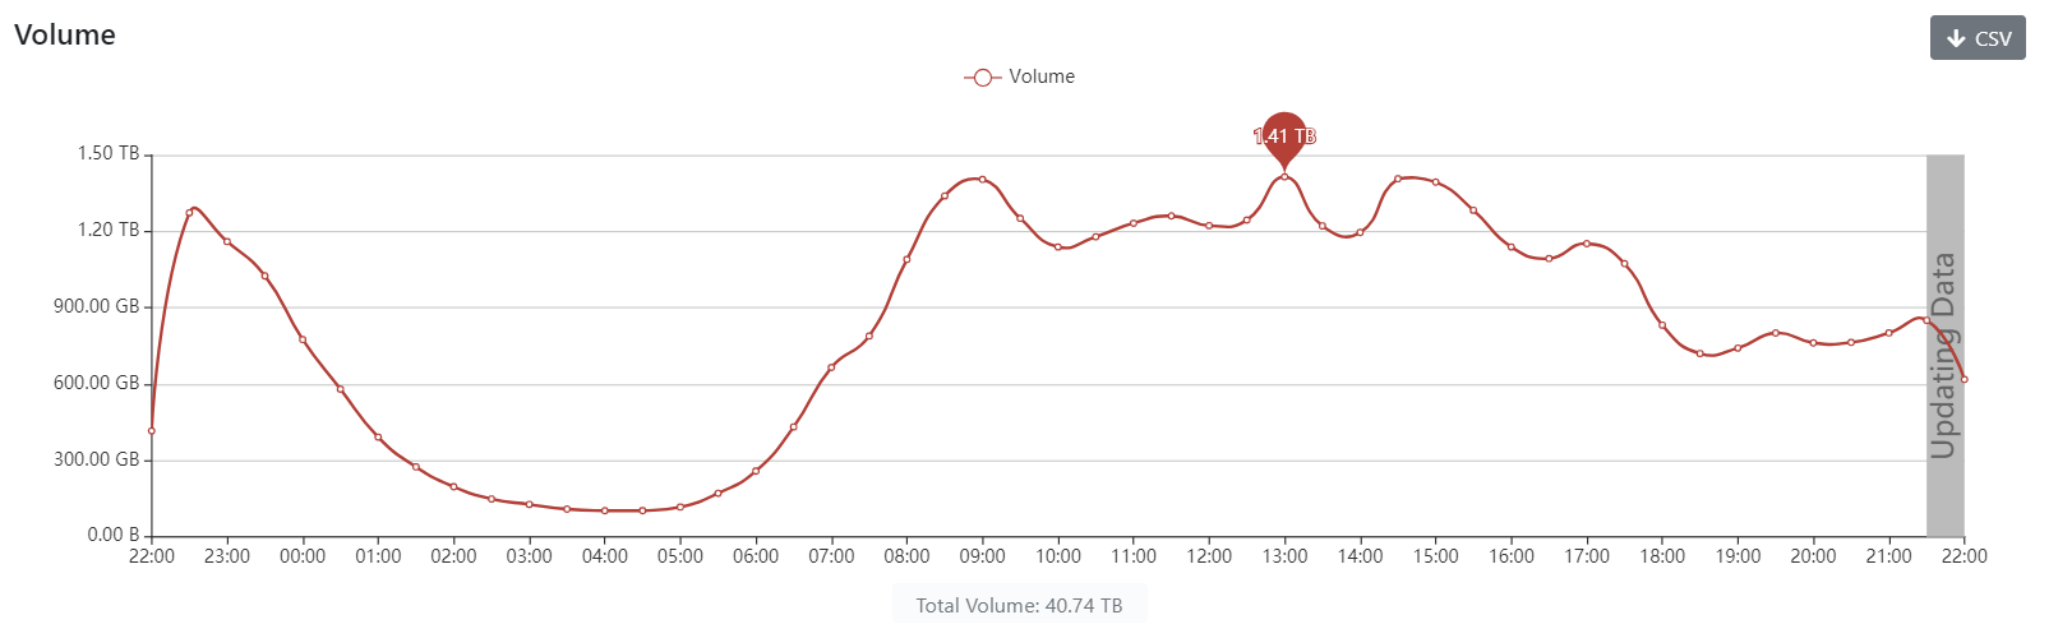
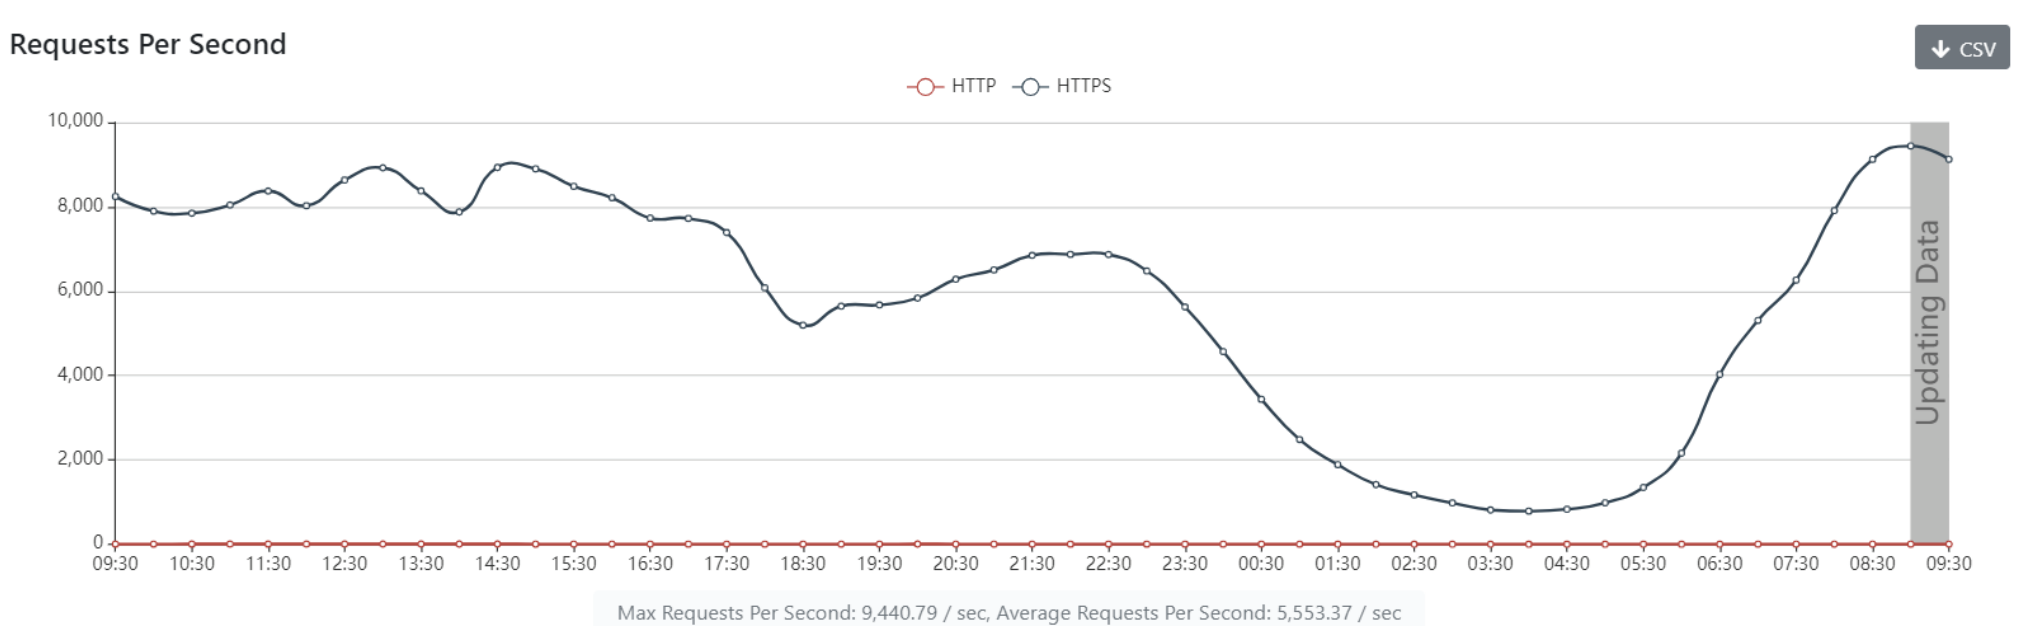
Chart of HTTP and HTTPS Connections Per Second
Cache Hit Rate Performance Chart (Requests and Bytes)
The byte hit ratio is calculated based on the percentage of bytes served from the cache compared to the total bytes delivered to end users, including bytes from the origin server. A higher hit ratio indicates better performance, with more content served directly from the cache.
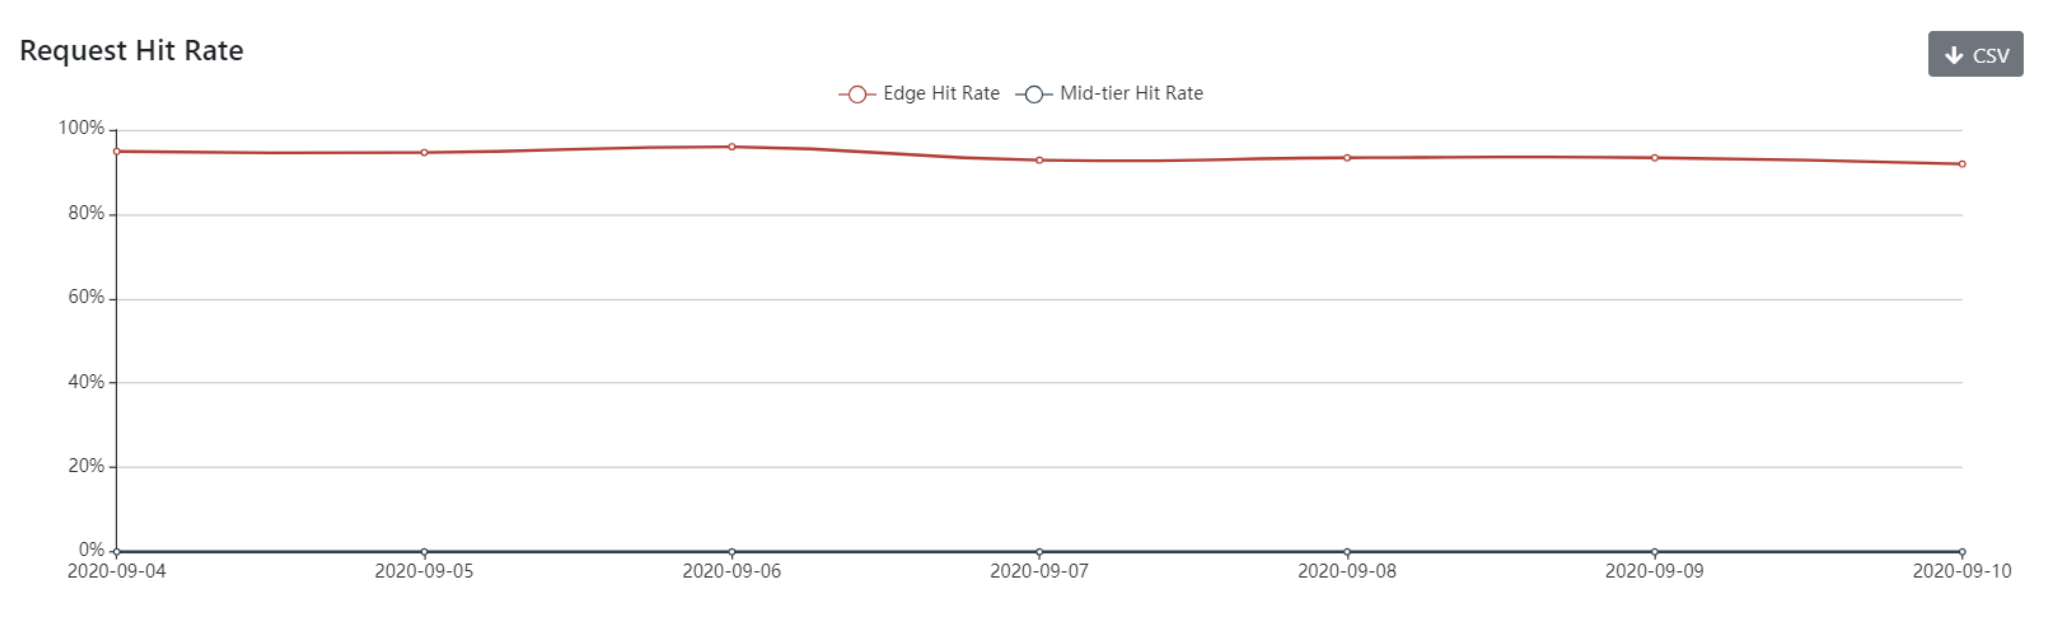
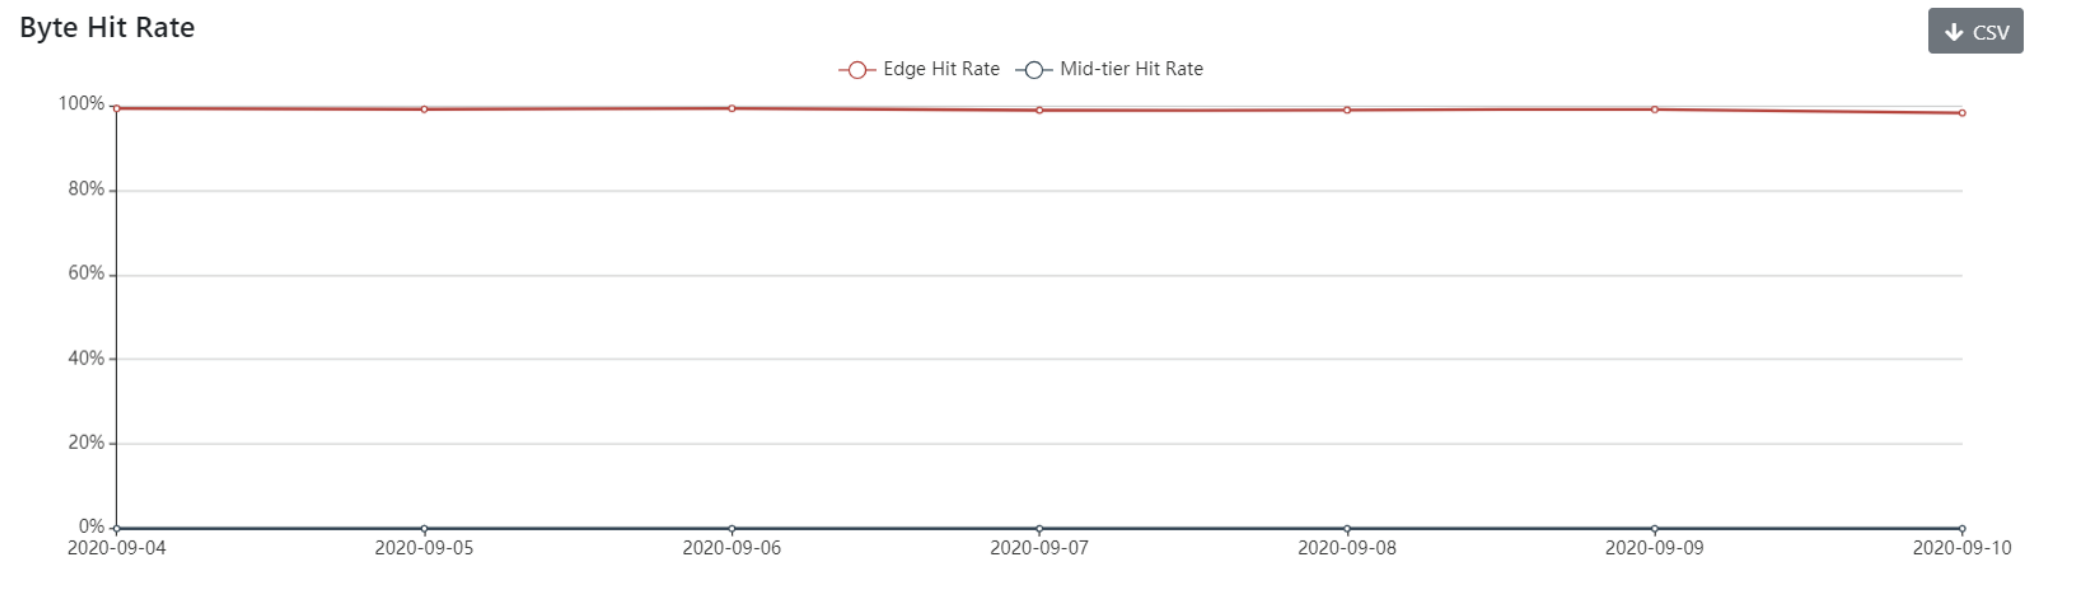
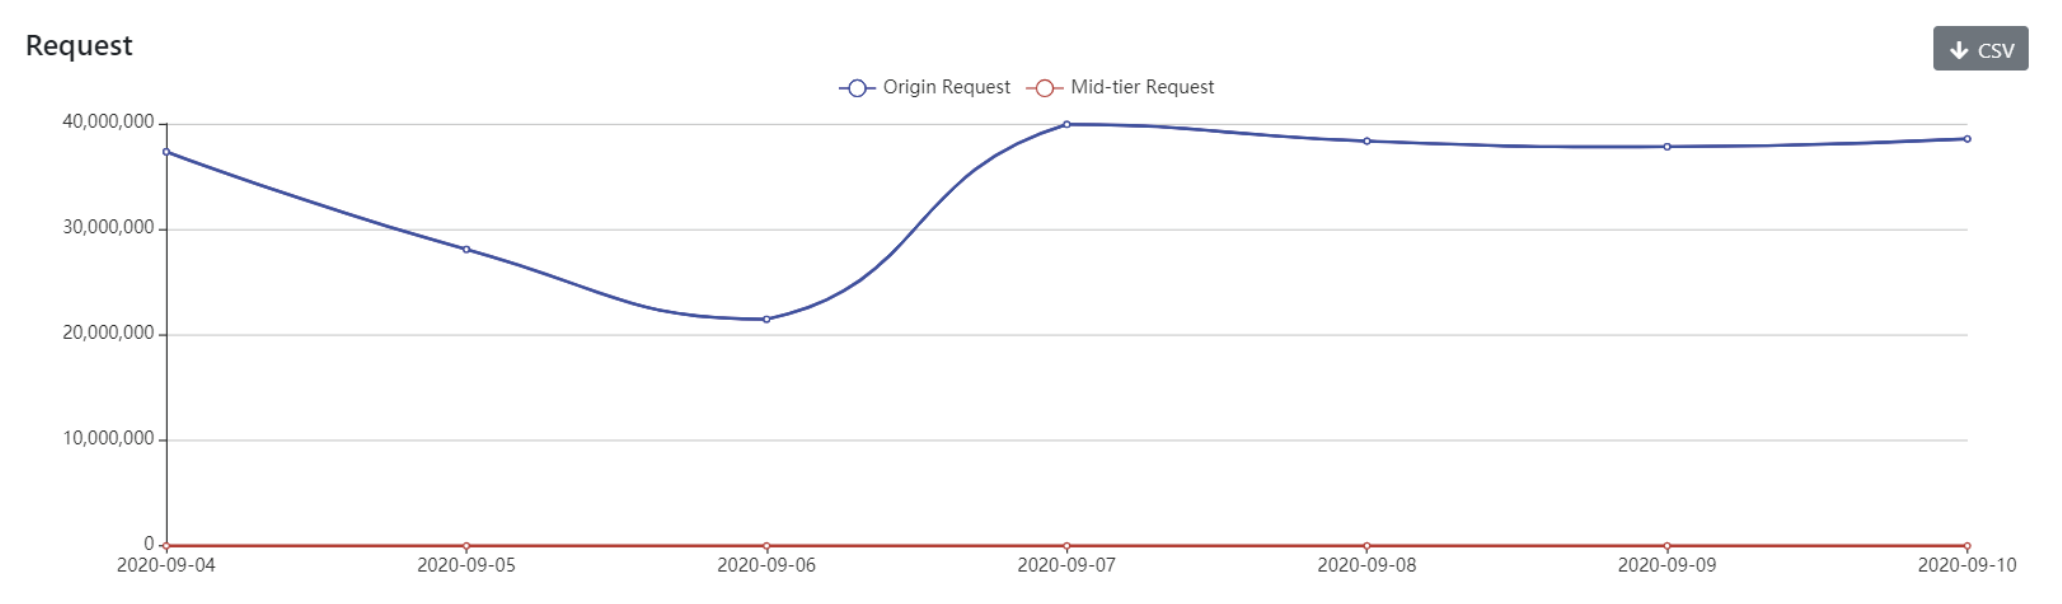
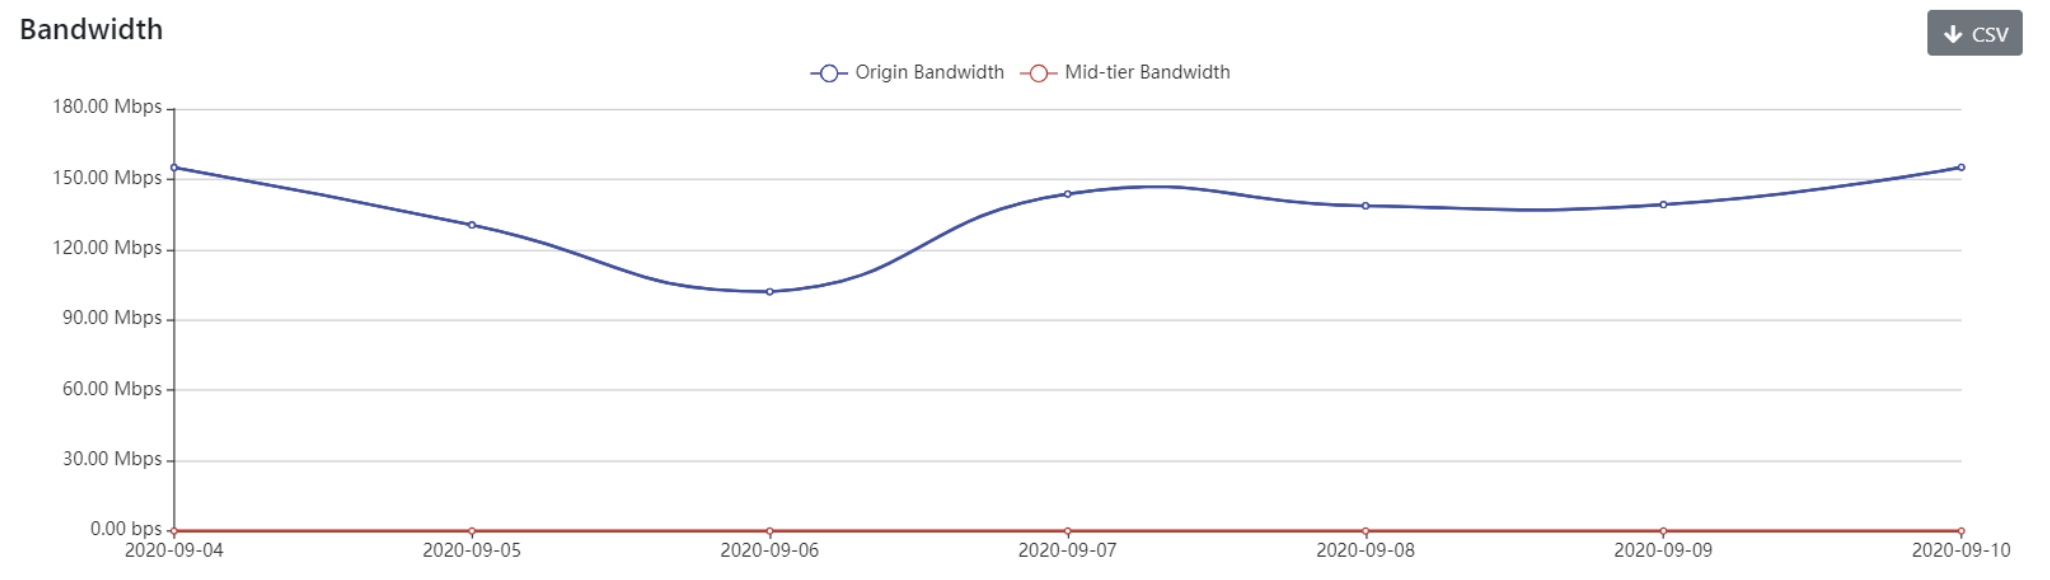
Chart of Connections to the Origin Server and Bandwidth
This chart represents the number of connections made to the origin server. Fewer connections indicate that the CDN serves more resources from its cache. The mid-tier connection/bandwidth chart will be displayed if the mid-tier caching service is used.
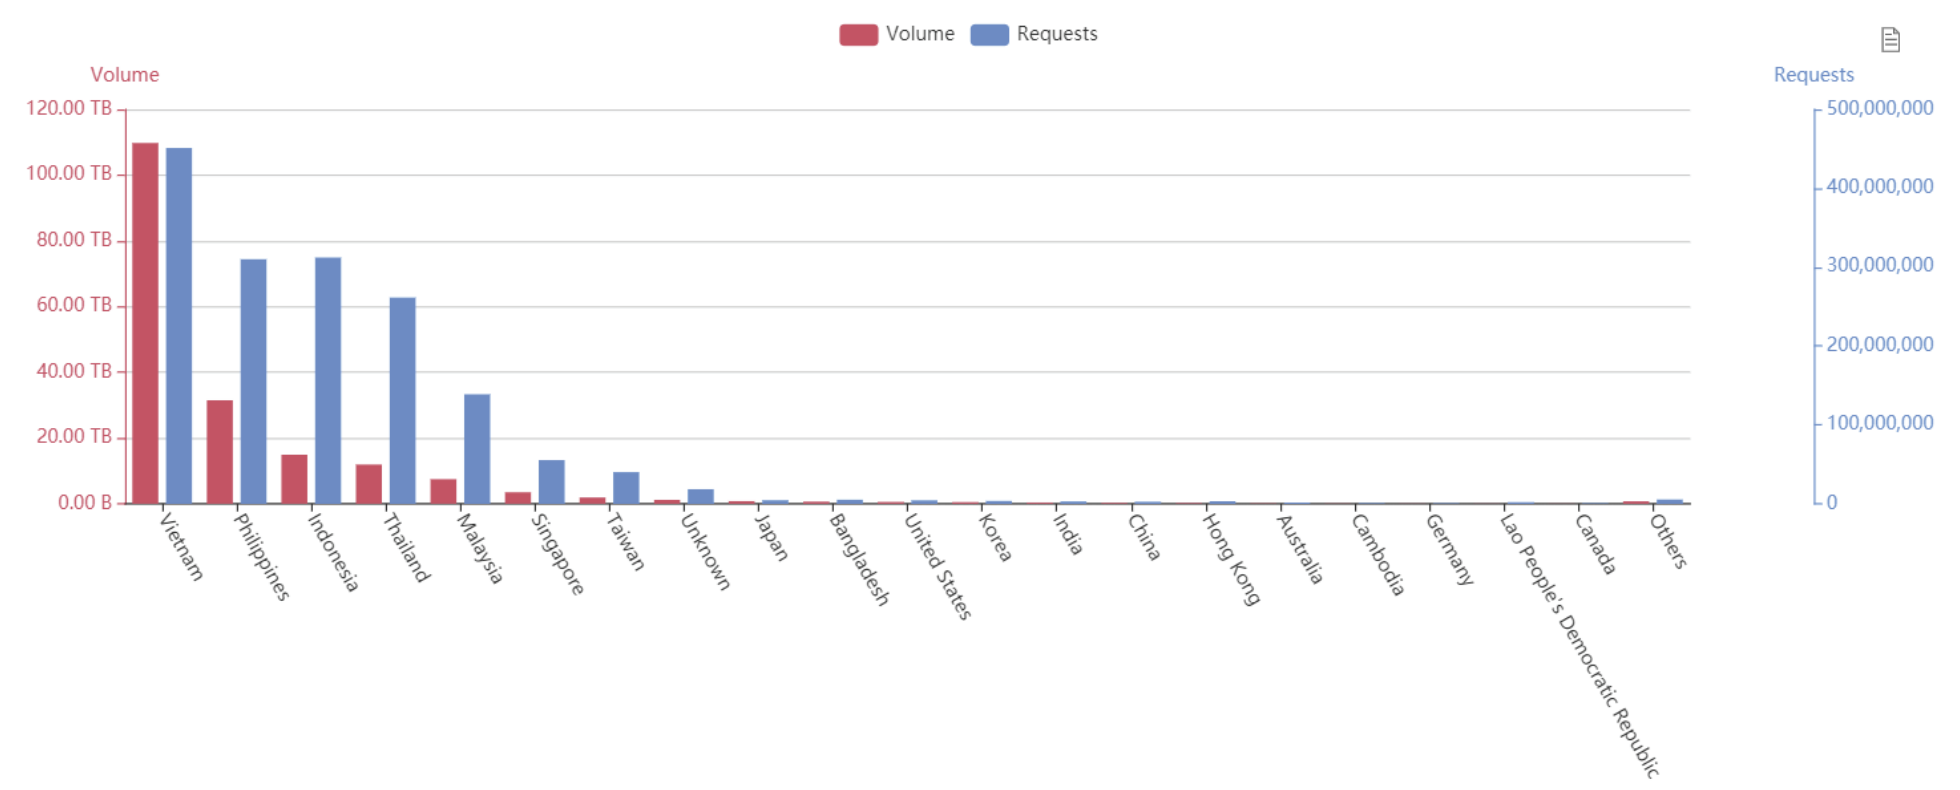
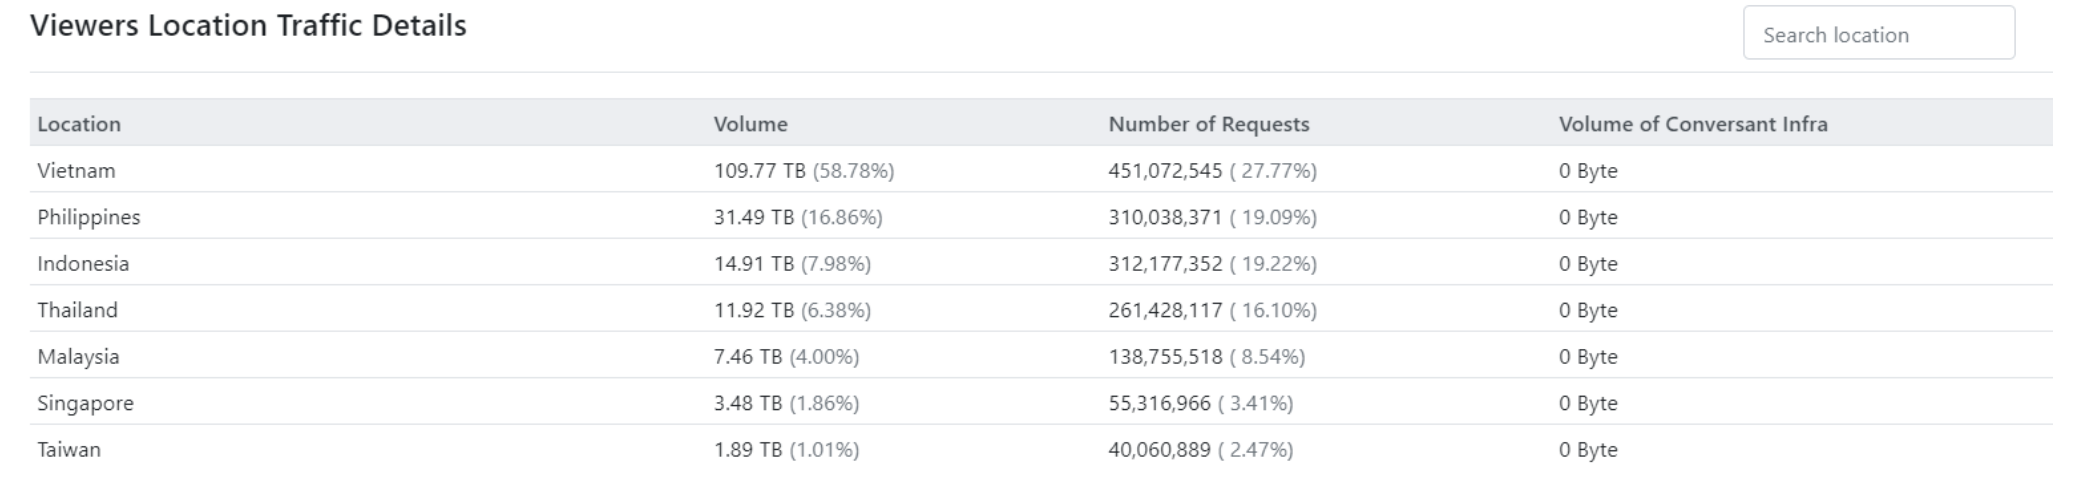
Visitor Location Chart
This chart displays the number of users accessing the content by country.
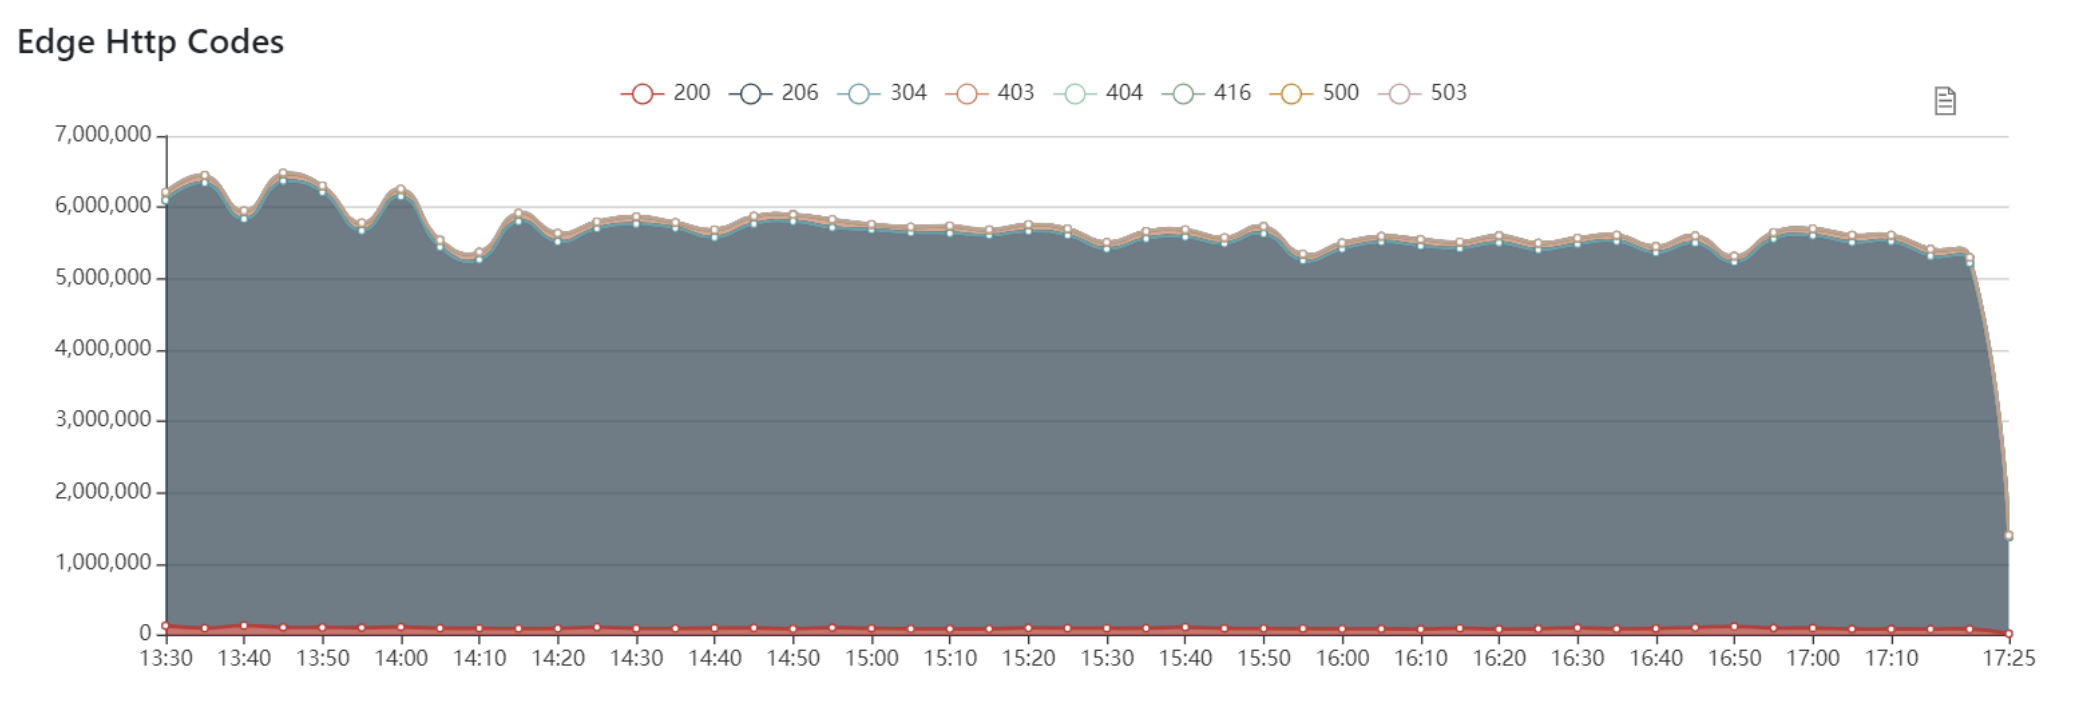
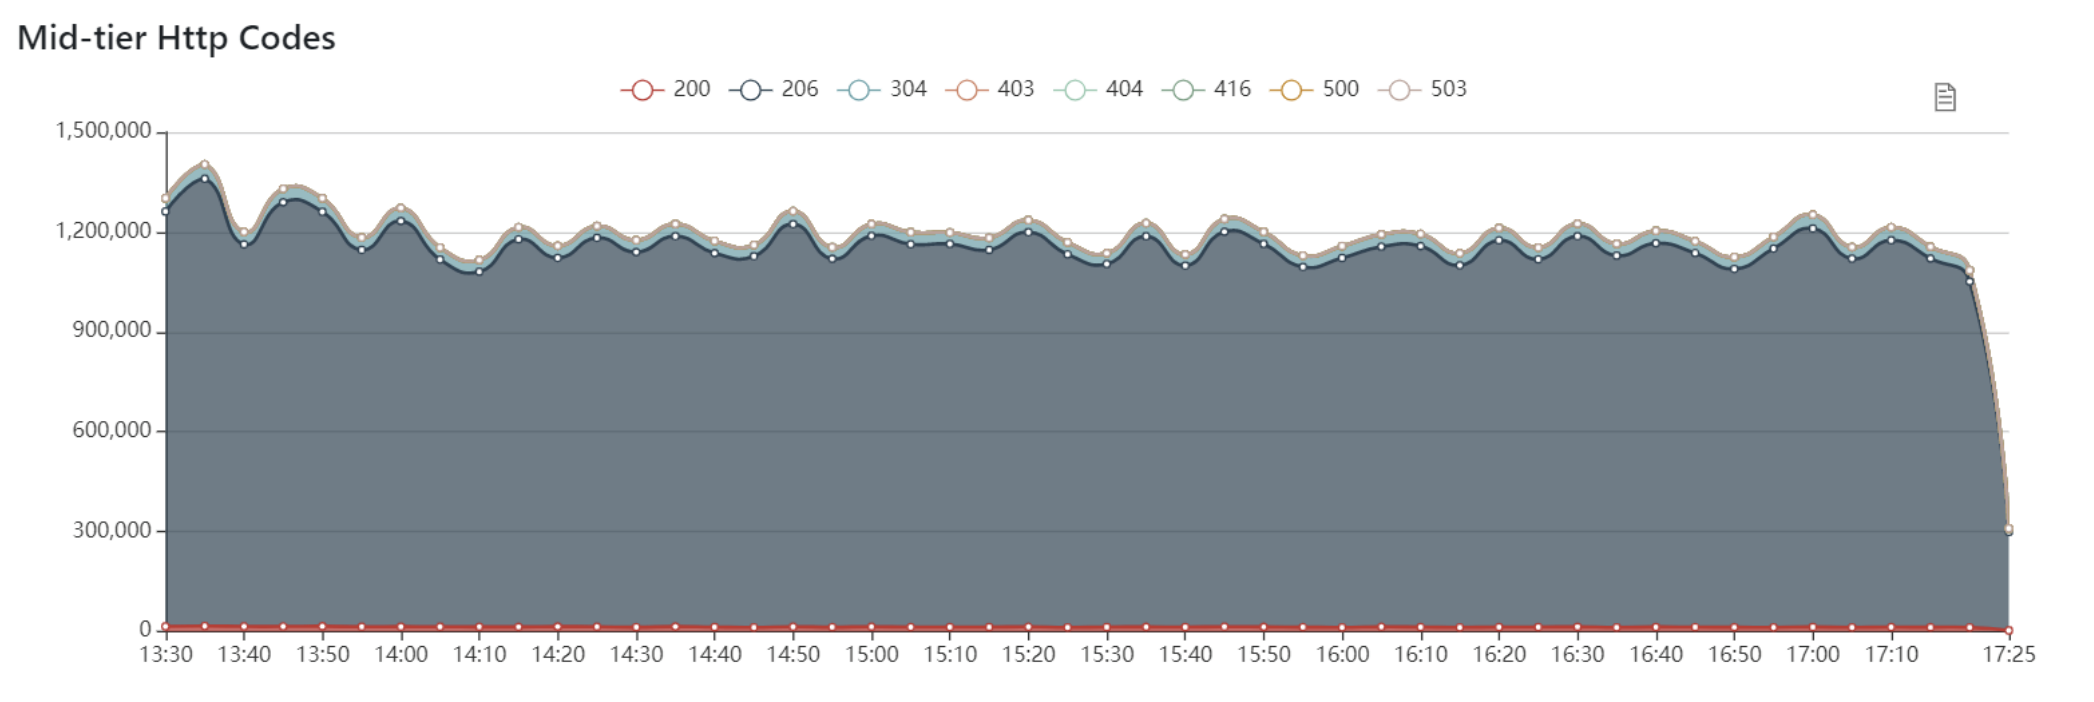
HTTP Status Code Chart
This chart provides information about the HTTP status codes returned by the CDN system.
Most responses will be 2xx status codes. If a large number of other status codes appear, an investigation should be conducted to determine the cause. The mid-tier HTTP status code chart will be displayed when the mid-tier service is used.