Analytics, Business Usage & Logs
Analytics
The Analytics page is the deep dashboard — filter by Domain and Time Range (e.g. Last 12 Hours) and switch across tabs: Monitoring · Delivery Overview · Security Overview · AI-WAF · Bot Management · API · Threat Investigation.
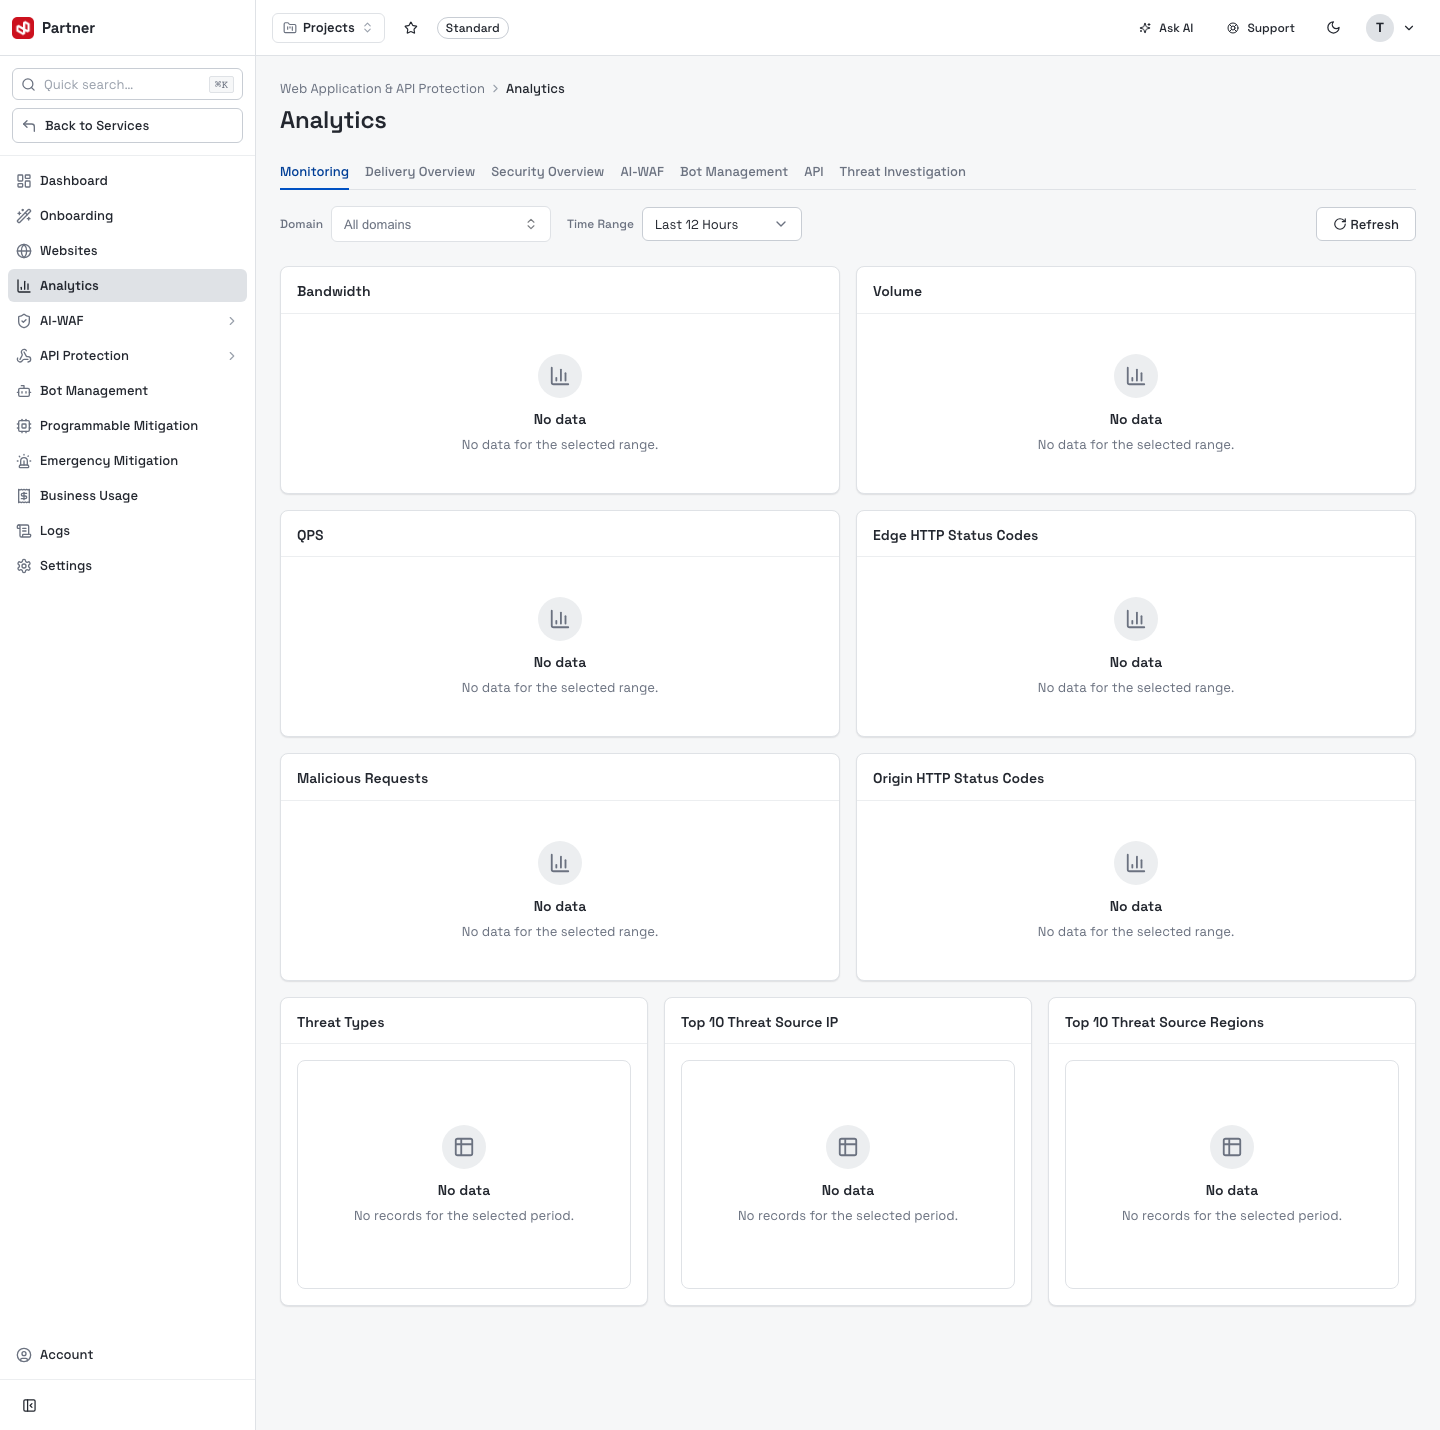
The Monitoring tab charts Bandwidth, Volume, QPS, Edge HTTP Status Codes, Malicious Requests, Origin HTTP Status Codes, plus Threat Types, Top 10 Threat Source IP and Top 10 Threat Source Regions. Each tab is a focused dashboard:
| Tab | Covers |
|---|---|
| Monitoring | Traffic + threat overview (bandwidth, volume, QPS, status codes, malicious requests). |
| Delivery Overview | Content-delivery / edge performance. |
| Security Overview | Security posture across your sites. |
| AI-WAF | WAF hits, blocked requests, matched policies. |
| Bot Management | Bot vs. human traffic and actions. |
| API | API traffic and API-protection findings. |
| Threat Investigation | Drill into individual threats/events for forensics. |
For example, the Security Overview and Threat Investigation tabs:
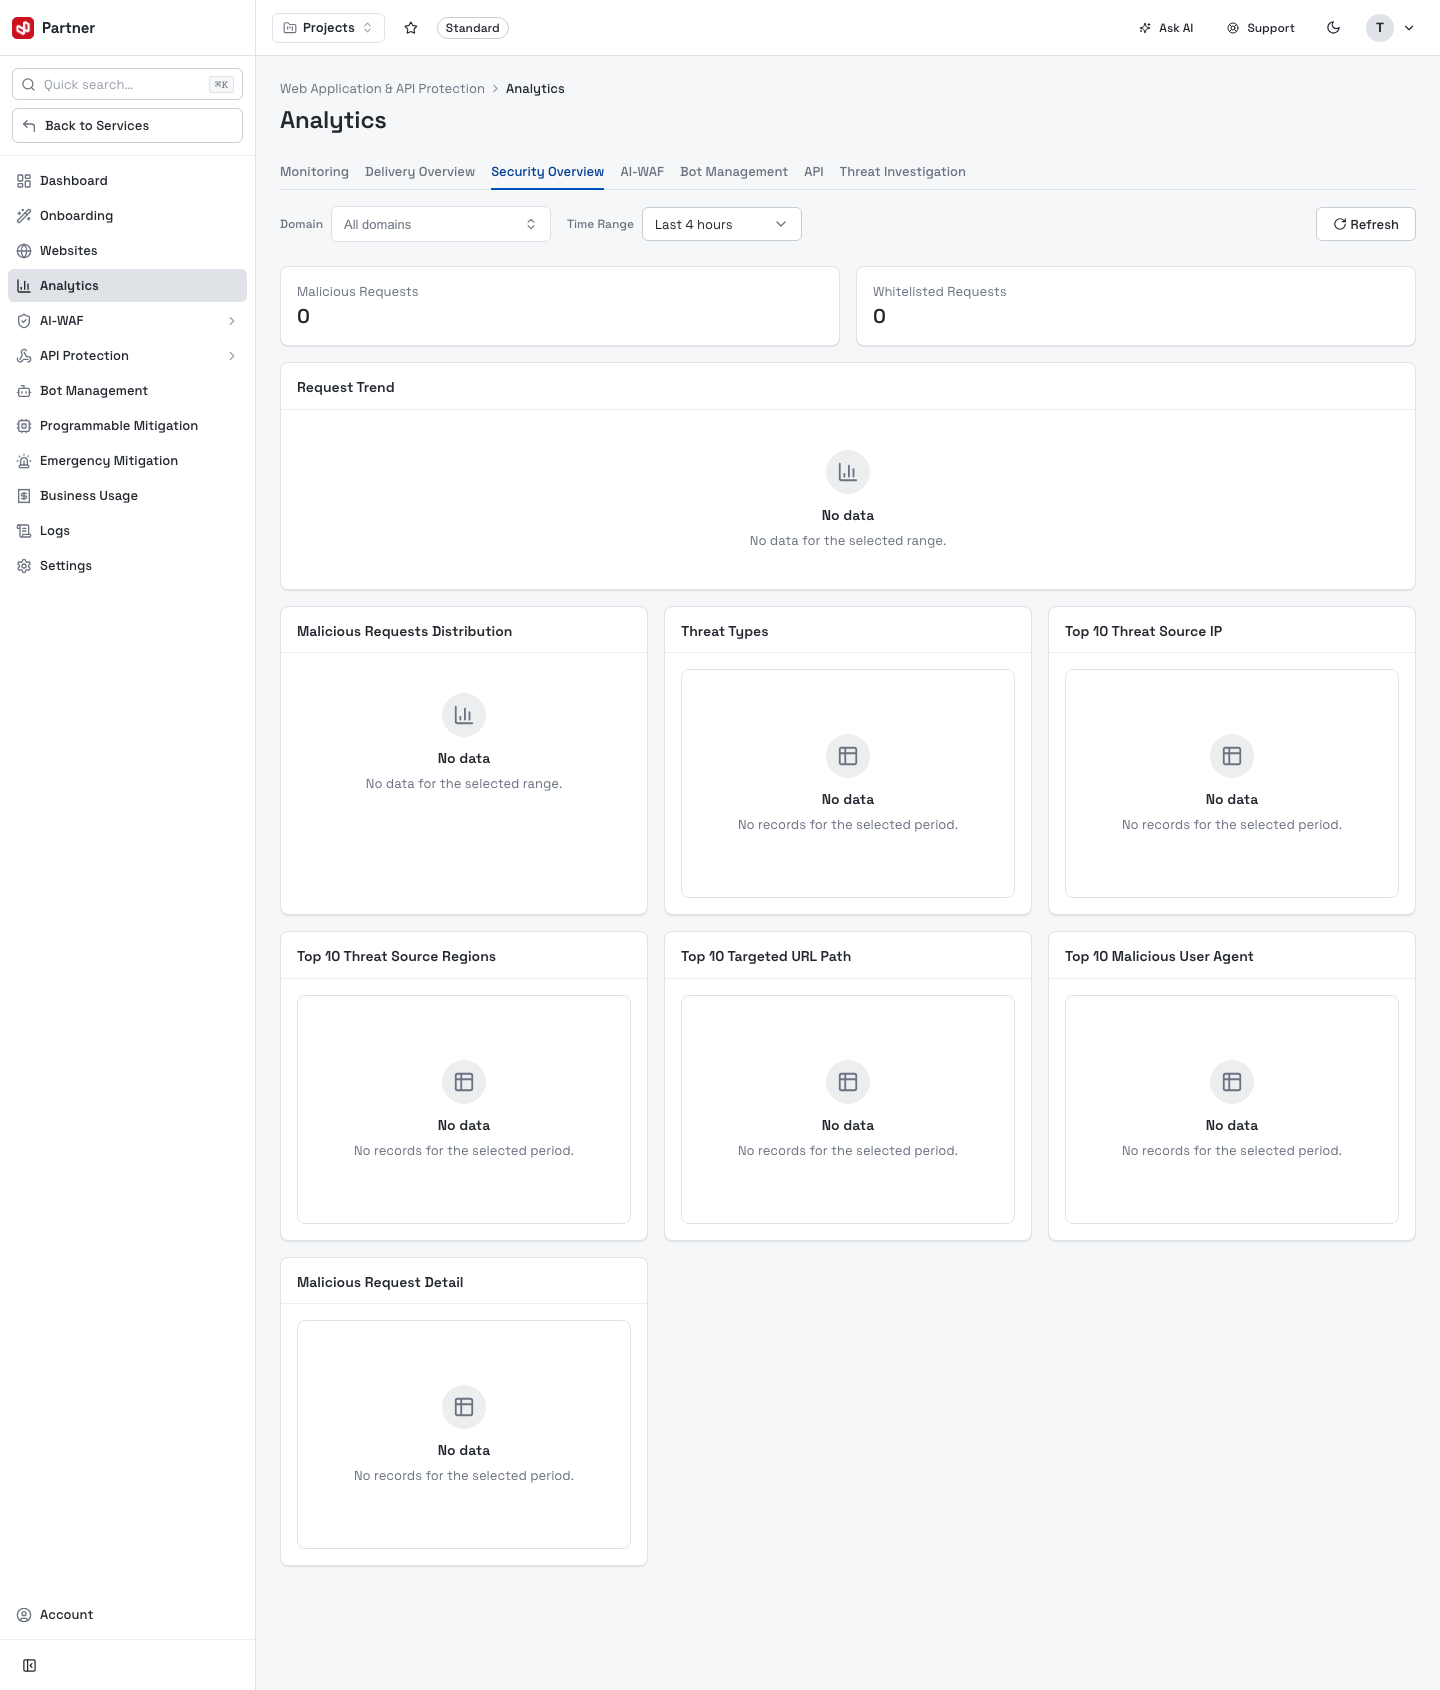
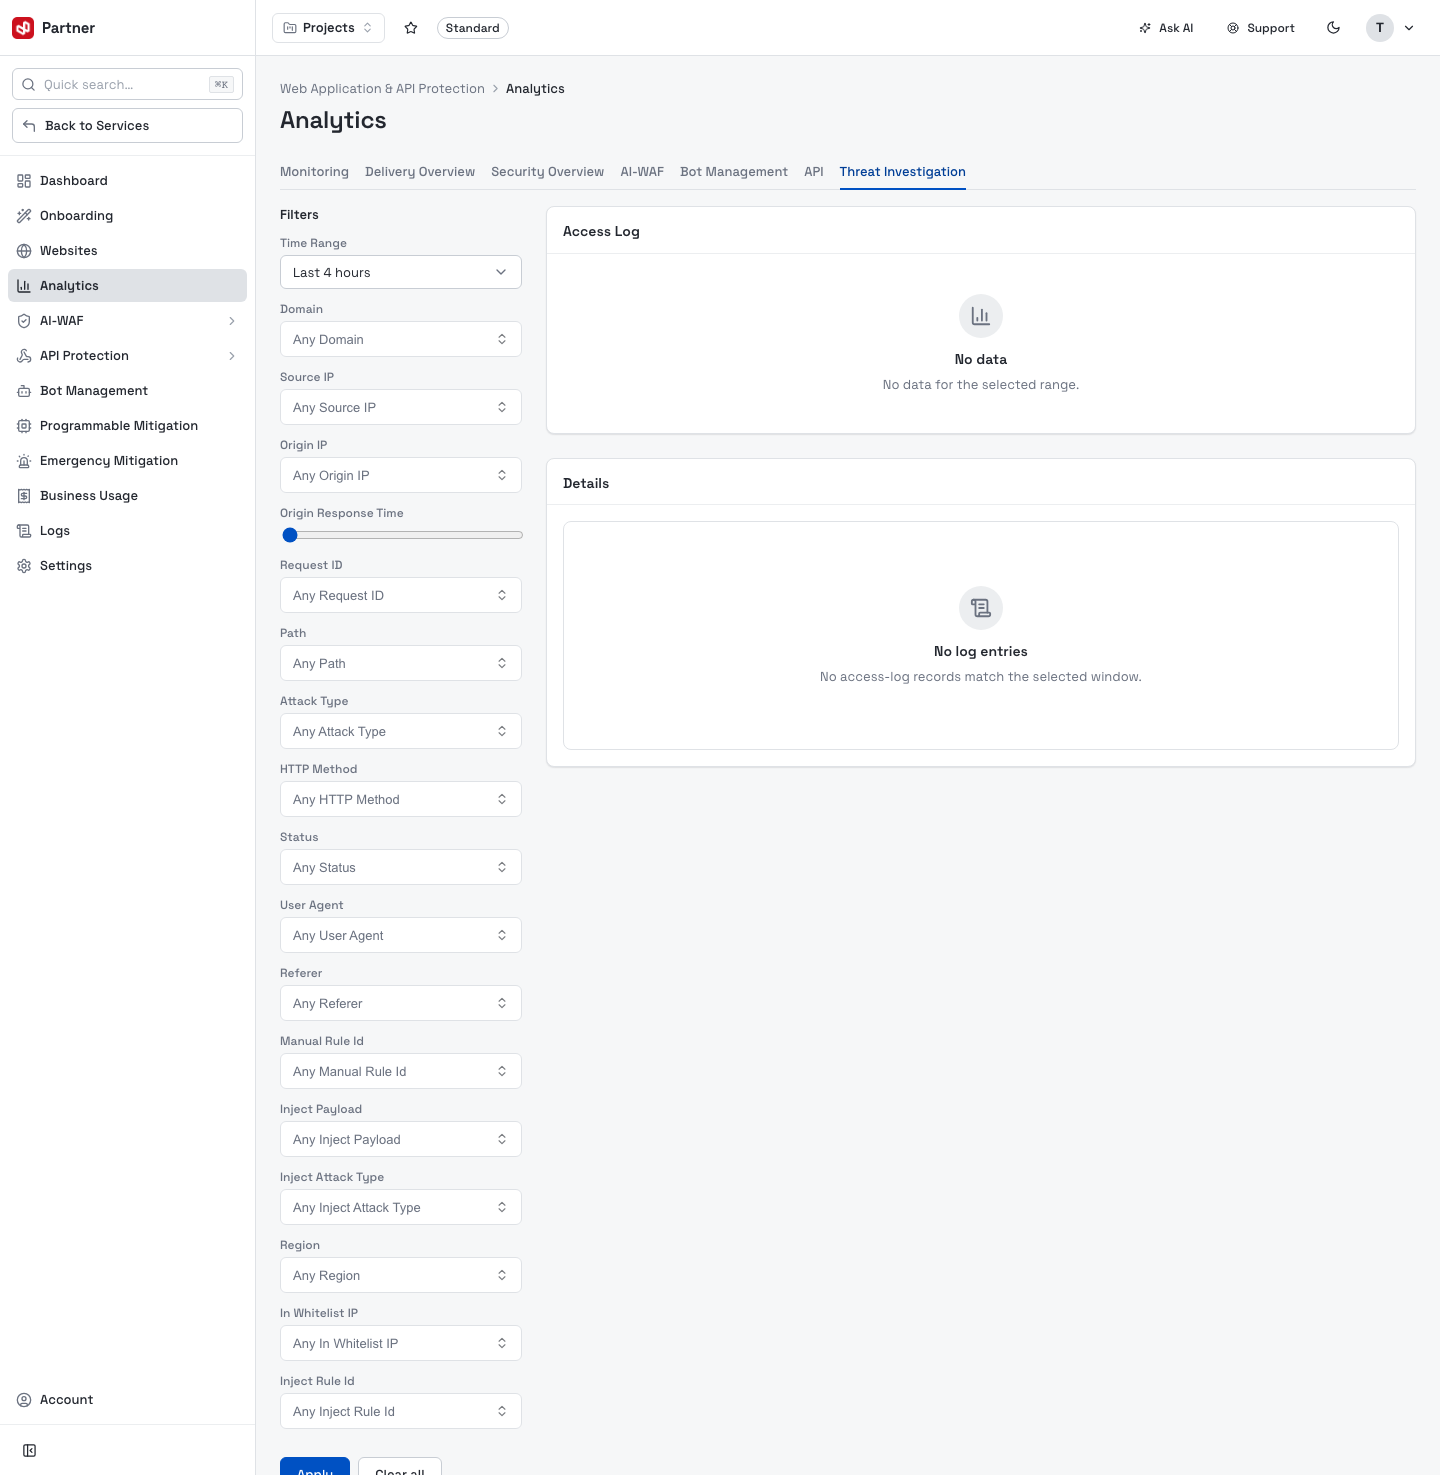
Charts read No data until an onboarded website receives traffic.
Business Usage
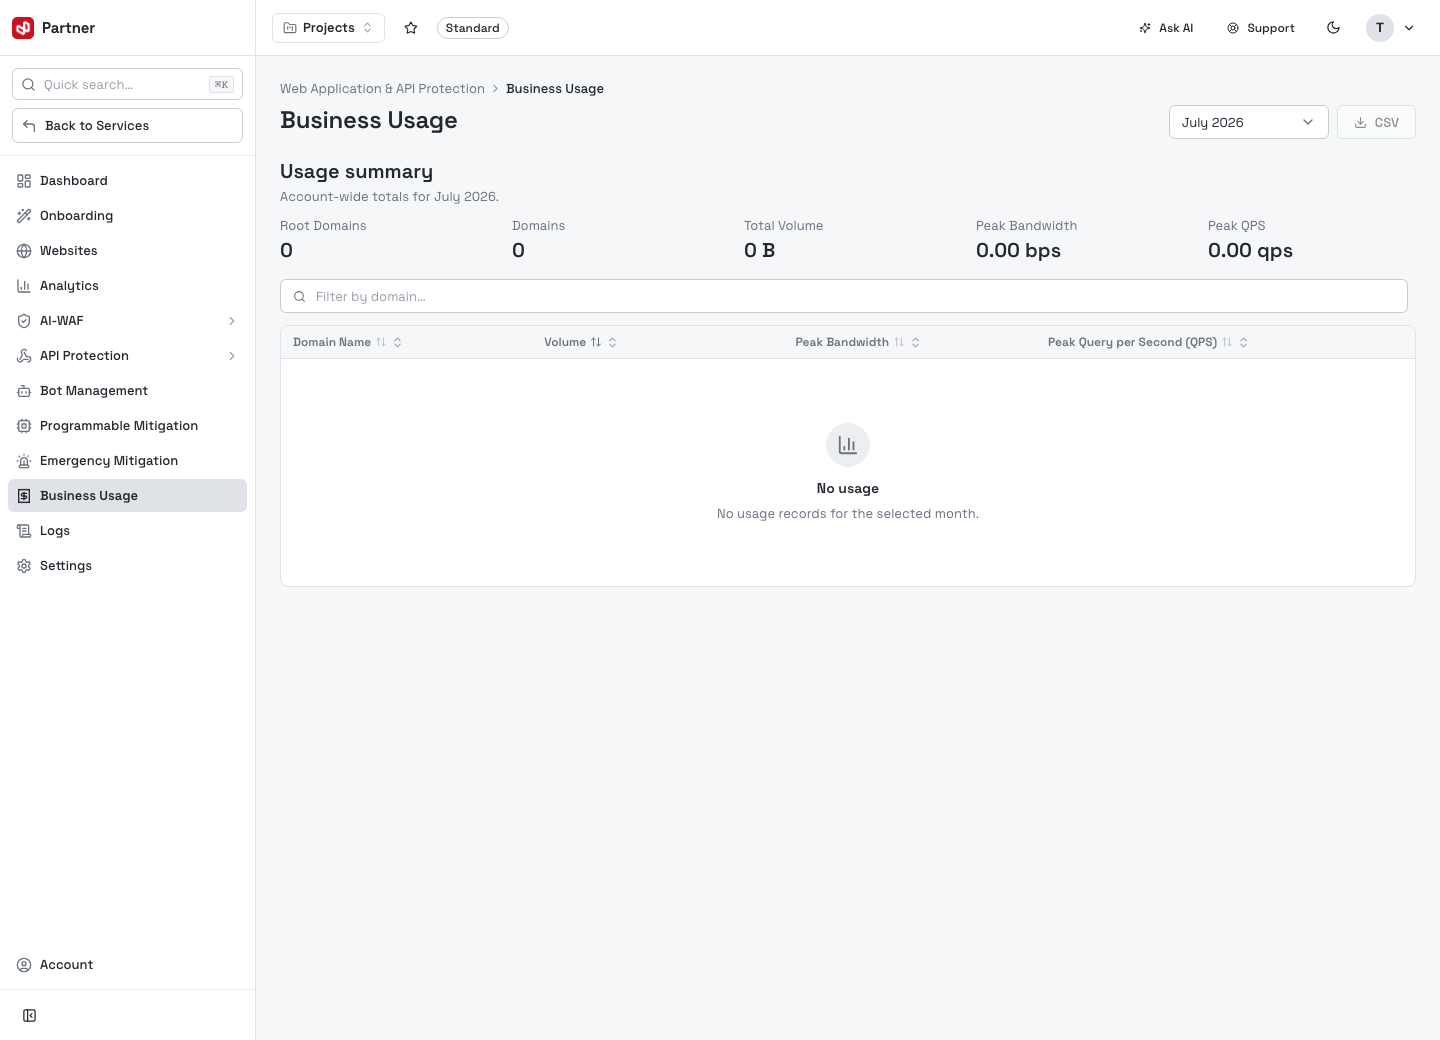
Your billable consumption for the WAAP service — bandwidth, requests and other metered usage that drives billing against your plan.
Logs
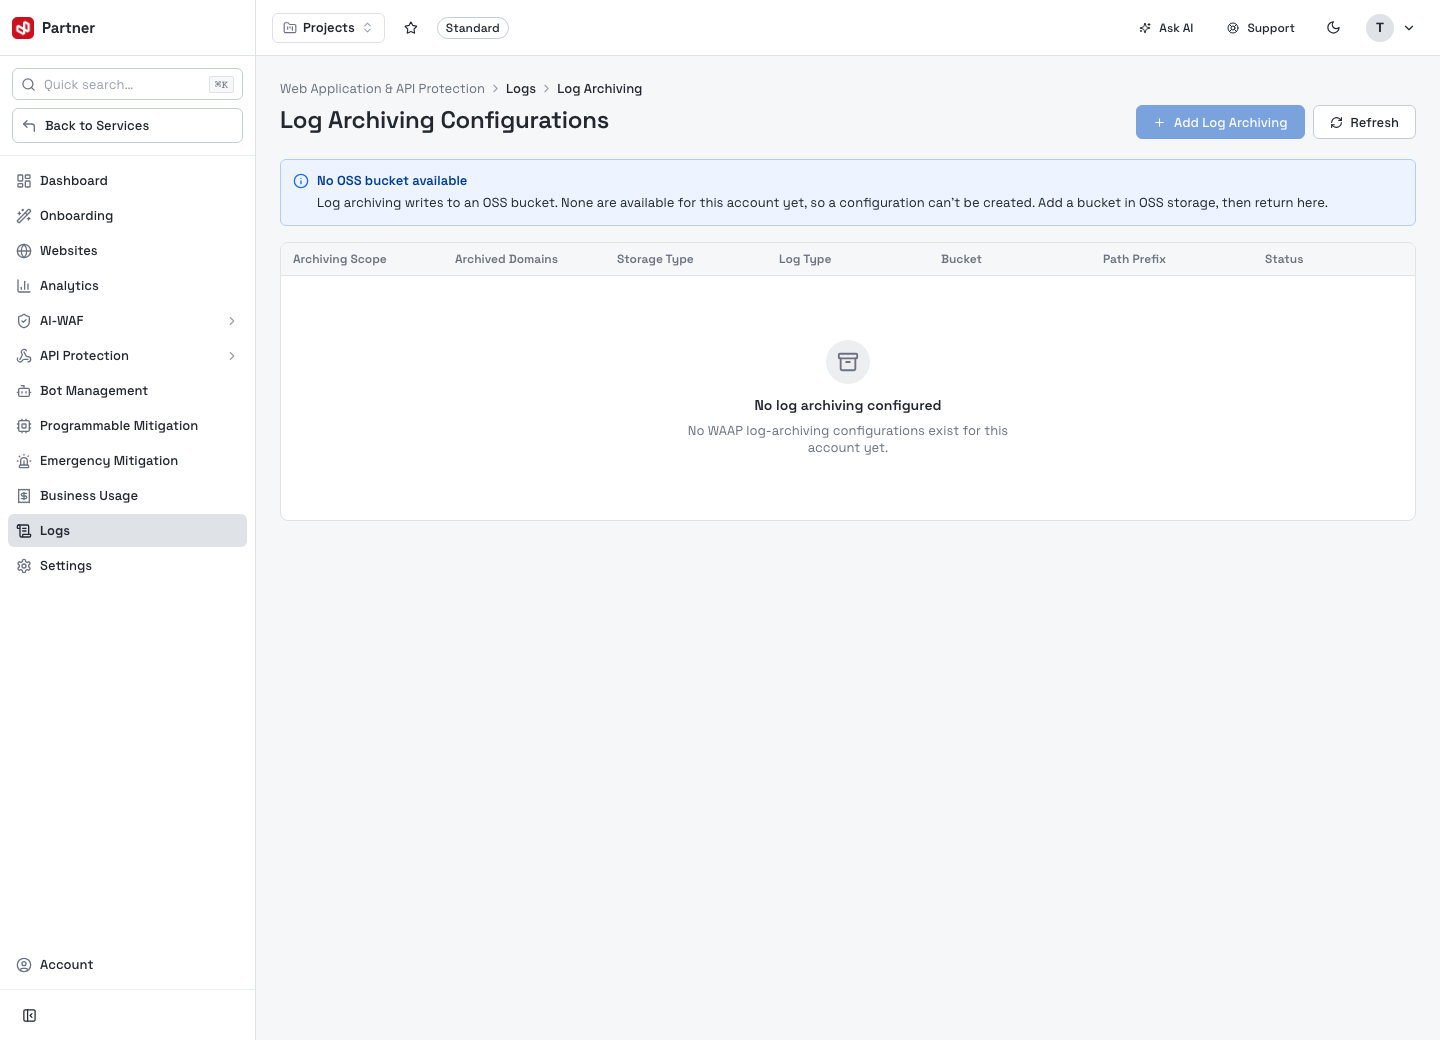
Raw request/event logs for investigation — search and filter individual requests and security events to understand exactly what WAAP saw and did.