Healthcheck & Alerting
Healthcheck & Alerting probes your endpoints, TCP ports, DNS records and TLS certificates from VNETWORK's network, tracks uptime and latency, and — when something breaks — raises an incident, notifies your team across channels, and can even run an automated remediation playbook. It turns "is the site up?" into a full detect → alert → respond loop you configure once.
Healthcheck & Alerting is in beta. Features and limits may still change, and you may hit the occasional rough edge.
When to use it
Use Healthcheck to know before your customers do — monitor public sites, APIs, ports and certificate expiry from the edge, route incidents to the right people, and (optionally) auto-mitigate attacks the moment an alarm fires. It pairs naturally with WAAP and Multi-CDN: watch what you deliver and protect.
Concepts
| Concept | What it is |
|---|---|
| Monitor (watchpoint) | A single check — an HTTP URL, TCP port, DNS record, TLS certificate or a data-driven signal — that runs on a schedule and reports Up / Down. |
| Incident | An event opened when a monitor's alarm condition is met; you acknowledge and resolve it. |
| Alarm | An alert rule attached to a monitor: the condition that opens an incident, its severity, and where to notify. |
| Channel | A notification destination — Telegram, Email (SMTP), Slack, Microsoft Teams or a custom webhook — with its own subscribers. |
| Playbook | An automated remediation runbook that runs a sequence of actions when a linked alarm fires. |
Activate & choose a project
Healthcheck is self-serve from the Partner Portal:
- Open Services → Observability → Healthcheck & Alerting.
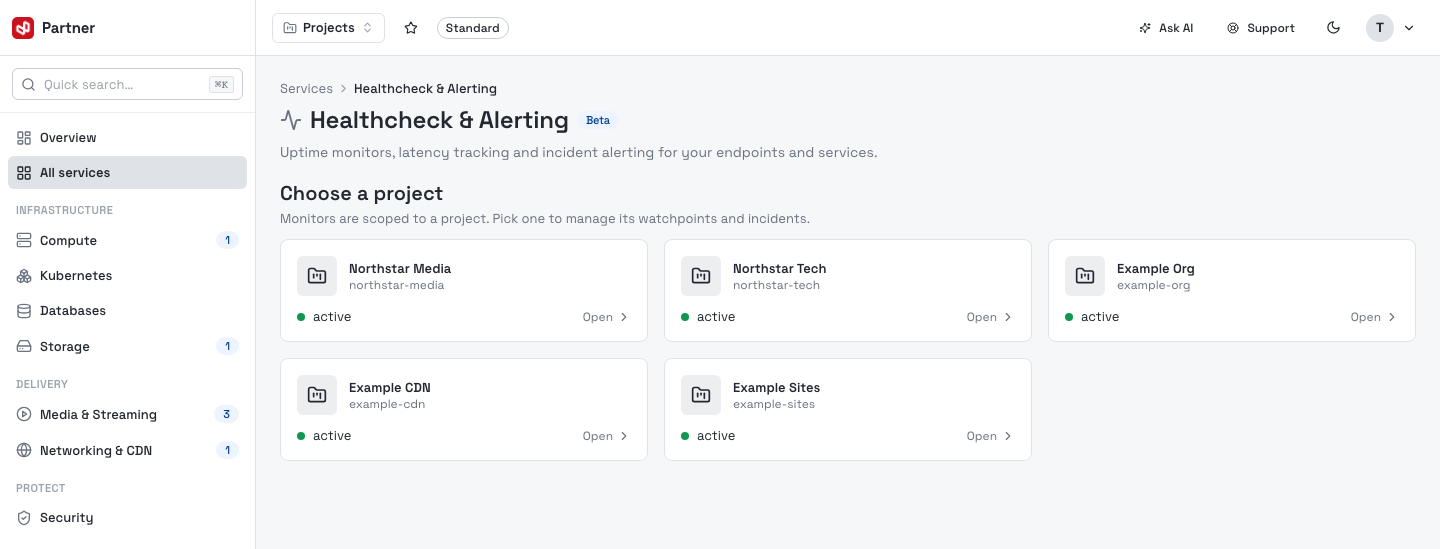
- Monitors are scoped to a project, so the console opens on a project picker. Pick the project whose endpoints you want to monitor. (With a single project, it jumps straight in.)
The console & navigation
Inside a project the left navigation groups the console into:
- Dashboard — uptime, latency and incidents at a glance.
- Monitors — create and manage watchpoints.
- Incidents — alarm events to acknowledge and resolve.
- Notifications — channels alerts are delivered to.
- Alarms — the alert rules that open incidents.
- Playbooks — automated remediation runbooks.
Dashboard
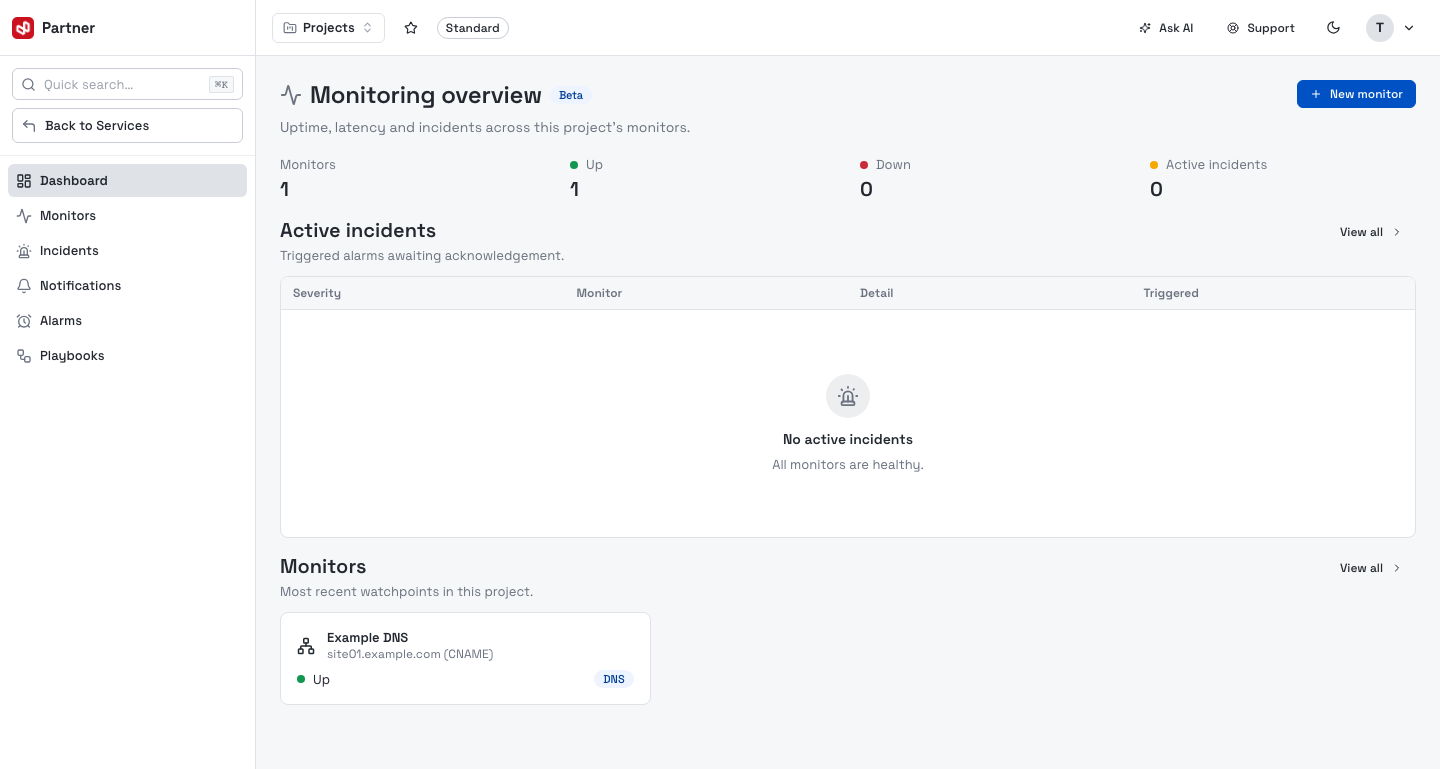
The Dashboard is a project-wide overview: headline counts (Monitors, Up, Down, Active incidents), a table of Active incidents awaiting acknowledgement, and cards for your most recent monitors.
Getting started (first run)
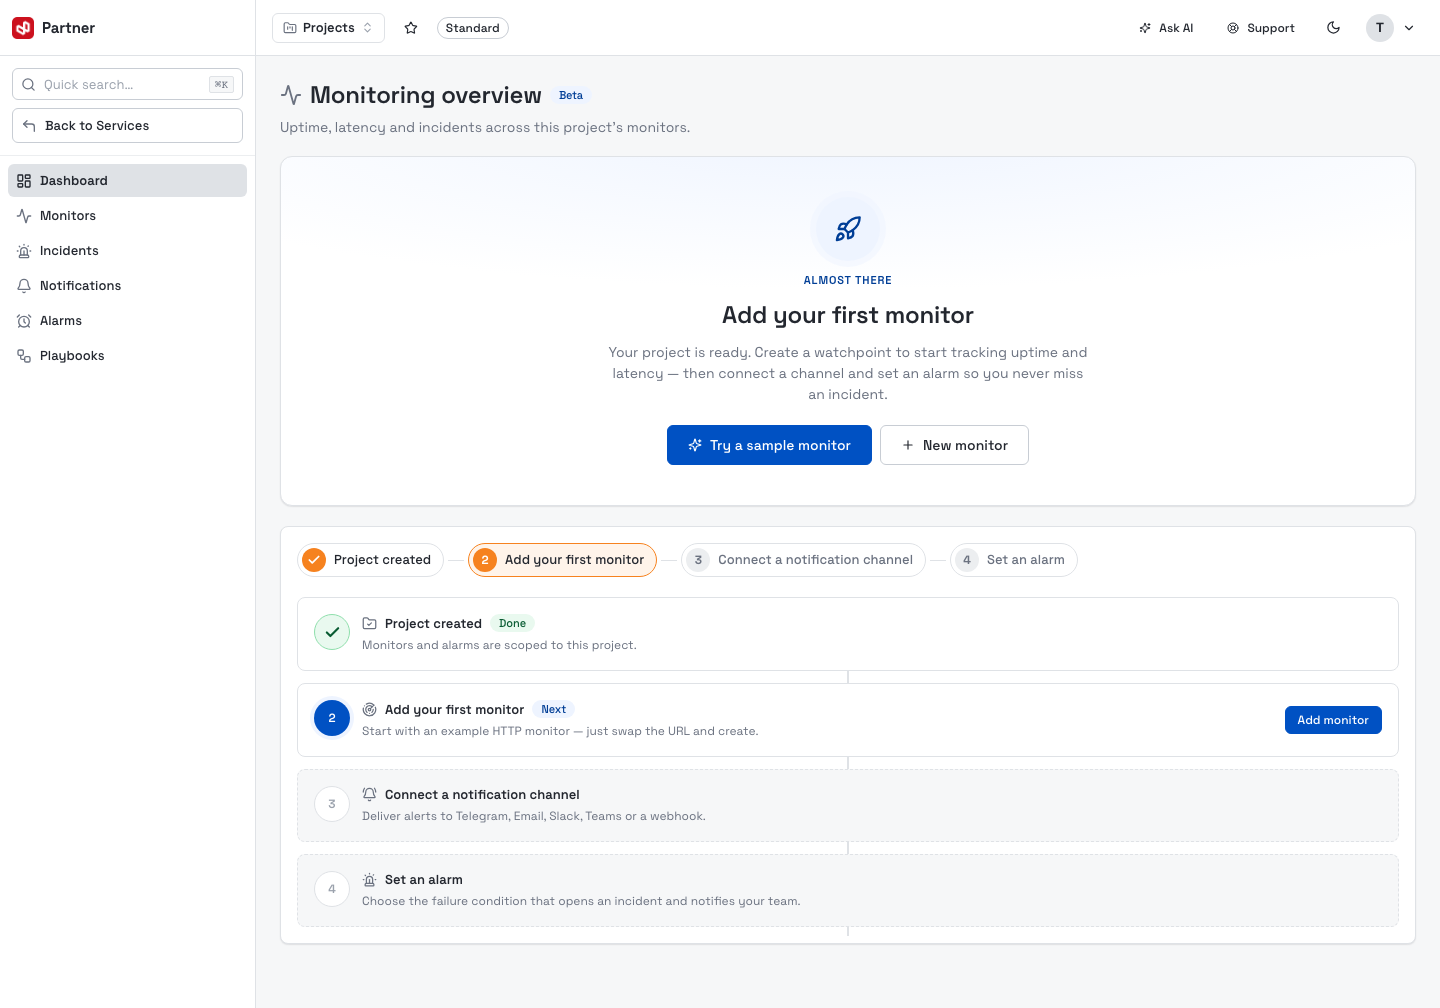
A brand-new project shows a guided checklist instead of an empty dashboard. Try a sample monitor pre-fills an example HTTP check you can tweak and create, or New monitor starts blank. The four-step journey is: create the project → add your first monitor → connect a notification channel → set an alarm.
In this guide
- Monitors — the watchpoint types, the create wizard, and the monitor detail (trend, check history, alerts).
- Incidents — acknowledge and resolve alarm events.
- Notifications — channels, providers and subscribers.
- Alarms — alert conditions, severity, channels and auto-remediation.
- Playbooks — automated remediation runbooks and the arm/disarm safety model.
- FAQ.