Anomaly detection
Static thresholds are hard to pick and drift out of date as traffic grows. Healthcheck learns each monitor's normal behaviour from a 7-day rolling baseline, then lets you either apply a suggested threshold (you approve the number) or alert on dynamic anomalies with the σ (sigma) operator — no fixed number required.
How it works
Every monitor runs on a schedule (its check interval, e.g. every 60s). Each run is one cycle: it collects the latest traffic and evaluates every alarm attached to the monitor.
Monitor ──every 60s──▶ one cycle: { 2xx:99, 4xx:5, US:52, WAFRULE:8, … }
                            │
                            ▼   for each alarm, check its condition
                      condition met? ──yes──▶ fire ──▶ notification (+ chart) to your channel
An alarm's condition is one of two kinds:
| Condition | Example | Fires when |
|---|---|---|
| Fixed threshold | count ≥ 50 | The value crosses a number you set. Simple; needs no history. |
| σ (sigma) anomaly | count σ ≥ 3 | The value is unusually far from its learned normal — no fixed number. |
The difference matters: a fixed ≥ 50 fires even when 50 is perfectly normal for that monitor,
while σ compares against what is normal for this bucket, at this time of day — so it adapts
instead of paging you on ordinary traffic.
The baseline
For every active monitor Healthcheck computes a rolling baseline over the last 7 days and refreshes it hourly. It records, per metric:
| Field | Meaning |
|---|---|
| mean (μ) | The typical value. |
| stddev (σ) | How much the value normally varies. |
| p95 | The 95th-percentile value. |
| samples | How many checks fed the baseline. |
Which metric is baselined depends on the monitor type:
- Elastic (WAF-log) monitors → the per-cycle request count.
- Protocol monitors (HTTP, TCP, DNS, TLS) → latency.
A brand-new monitor shows "Baseline accruing" until it has collected enough checks. The baseline and suggestions appear automatically once there are enough samples — no action needed.
Per-bucket baselines
A WAF-log monitor groups its traffic by a dimension (status code, HTTP method, country, mitigation…). Healthcheck baselines each bucket of that dimension separately, in addition to the total — so "normal" is learned per bucket, not just for total volume. That's what lets an alarm catch a surge in one specific bucket even while total traffic looks ordinary.
| Monitor groups by | Buckets baselined | A σ alarm catches |
|---|---|---|
| HTTP status | per status code — 200, 301, 404, 502, 429… | a spike in one code, e.g. 502 surge (baseline ≈ 0) or a 429 rate-limit storm |
| HTTP method / country / … | per method (GET/POST), per country… | e.g. a sudden burst of POST, or traffic from one country |
| WAF mitigation | per mitigation category — WAFRULE, SEO user agent, ACL-WHITE-IP, EDGE… | a jump in WAFRULE blocks (attack) or bot hits, vs that category's normal |
| request count (total) | the whole monitor's per-cycle total | an overall traffic spike / drop (volumetric DDoS, outage) |
High-cardinality dimensions (per-IP, per-URL) aren't bucketed — there'd be thousands of baselines — so those monitors keep just the total count baseline.
Time-of-day (seasonal) baselines
Traffic has a daily rhythm — busy by day, quiet at night — so a single 7-day average would be too high at night and too low at peak. Healthcheck therefore baselines each hour of the day (0–23, UTC) separately, and a σ alarm compares the current cycle against that hour's baseline.
ACL-WHITE-IP bucket | mean |
|---|---|
| All-hours average | 27.6 |
| 05:00 (night) | 10.9 |
| 07:00 (morning peak) | 87.3 |
So 80 requests at 07:00 is normal (≈ the 87 baseline), while 80 at 05:00 is a clear anomaly — a distinction the flat 27.6 average would hide. When an hour hasn't collected enough samples yet, the alarm falls back to the all-hours baseline.
Baseline & suggested thresholds
Open a monitor's detail and find the Baseline & suggested thresholds panel. It shows the total baseline (μ ± σ, p95, sample count) as a chart of recent history against the baseline mean plus a status breakdown donut, and — for WAF-log monitors — a per-bucket baselines table, each bucket with its own suggested thresholds.
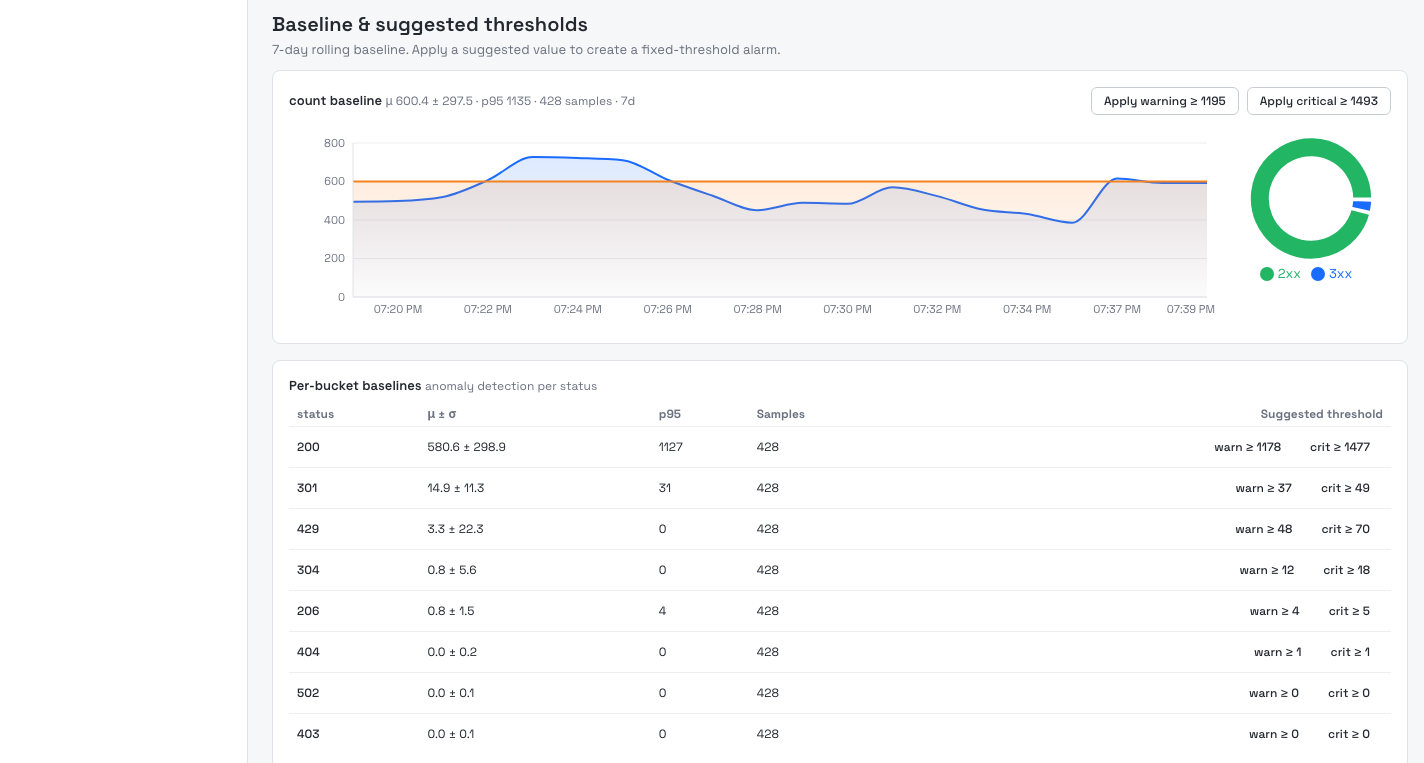
Two suggested thresholds are offered:
| Suggestion | Value | Use for |
|---|---|---|
| Apply warning | mean + 2σ | An early heads-up. |
| Apply critical | mean + 3σ | A strong, rarely-false signal. |
Selecting Apply warning or Apply critical opens the alarm form pre-filled with a fixed-threshold condition at that value. You review it, name the rule, pick a notification channel, and save — the number is never applied automatically, so you stay in control.
Dynamic anomalies: the sigma operator
Instead of a fixed number, an alarm condition can use the σ (sigma) operator to fire whenever the value is unusually high relative to the current baseline. In the condition builder, pick a baselined field (count for WAF-log monitors, latency_ms for protocol monitors), choose the σ anomaly operator, and enter a multiplier k (default 3).
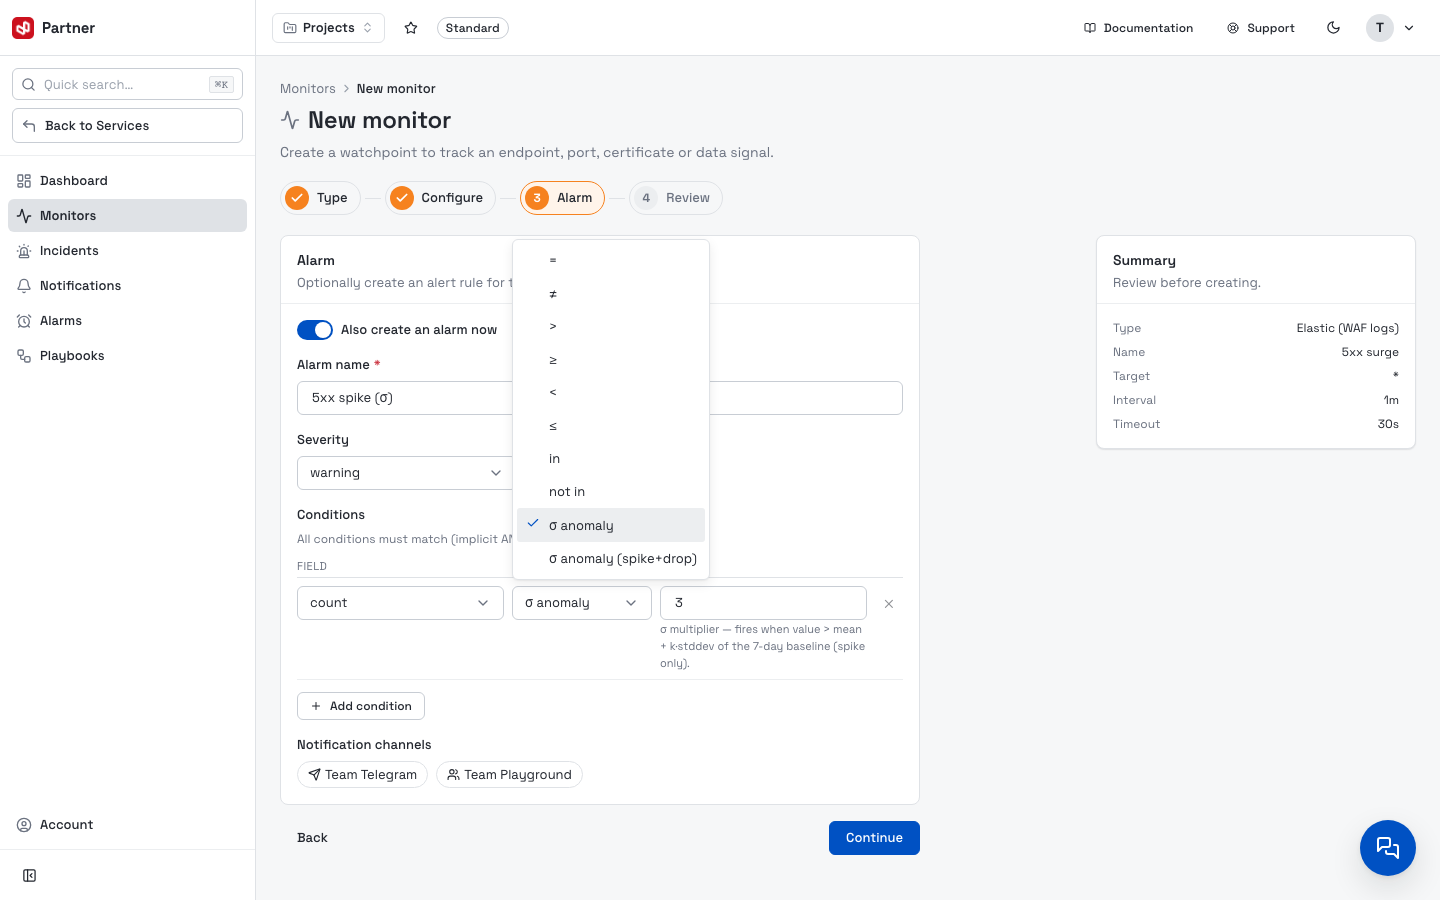
The alarm fires when:
value > mean + k × stddev
So k = 3 fires only when traffic spikes more than 3 standard deviations above normal — a
threshold that adjusts itself as the baseline moves. σ detects spikes (upper-tail
anomalies); use a lower k to be more sensitive.
Until a baseline exists, a σ alarm is fail-safe: it never fires. This avoids false alarms on a monitor that hasn't learned its normal behaviour yet.
Very bursty traffic has a large σ, so ordinary swings stay "normal" and only a genuine
surge trips k = 3. That's by design — it keeps everyday noise from paging you.
Spikes, drops, and per-source anomalies
The operator dropdown (above) offers two σ variants, plus derived per-source metrics for high-cardinality dimensions:
- σ anomaly (
$sigma) — upper-tail only; fires on spikes (value > mean + k·stddev). - σ anomaly (spike+drop) (
$sigma_abs) — two-sided; fires when|value − mean| ≥ k·stddev, so it also catches drops — a normally-active signal falling toward zero (an outage). - top source concentration / distinct sources — derived metrics on grouped WAF-log monitors. A σ alarm on top source concentration catches a single IP flooding (one source spikes); on distinct sources it catches a distributed scan (many IPs/URIs at once) — even when the total request count looks normal.
These are exactly what the Single-IP flood and Distributed scan monitor templates set up for you.
The anomaly notification
When a σ alarm fires, the notification carries a rich, SOC-style summary:
- A chart image — recent history with the baseline mean ± 1σ band and the current value marked.
- Finding — the z-score, e.g.
count z=3.5 · current 641 (baseline 512±88). - Status breakdown —
2xx · 3xx · 4xx · 5xxfor WAF-log monitors. - Top IP / Top URL — the top contributors, when the monitor groups by those dimensions.
The chart is attached on the first alert; periodic re-notifications while the incident stays open are text-only to keep the channel readable.
Reading the chart
The chart puts the current value in context:
 count ▲
    98 ┤ ─ ─ ─ ─ ─ ─ ─ ─ ─ ─ ─ ─    ← baseline mean (μ) for this hour  (dashed)
       │ ▒▒▒▒▒▒▒▒▒▒▒▒▒▒▒▒▒▒▒▒▒▒▒▒    ← expected ±1σ band  (μ ± σ) = "normal" range
    45 ┤ ▒▒▒▒╱╲▒▒▒▒▒▒▒▒▒╱╲▒▒▒▒▒▒▒
       │ ───╱──╲───────╱──╲────●    ← history (blue) per cycle; ● current value (red)
     0 └───────────────────────────▶  time (last ~30 min)
| Element | Meaning | Source |
|---|---|---|
| history (blue line) | the per-cycle value over the recent window (~30 min) | recent probe results |
| current (red dot) | the value that triggered this alert | this cycle |
| expected ±1σ (grey band) | the normal range — the hour's baseline mean ± 1σ | 7-day baseline, per hour |
| baseline mean (dashed) | the hour's average (μ) | baseline |
Read it at a glance:
- Inside the grey band → normal for this time of day.
- Above the band → a spike; the further above, the higher the z-score.
- Falling to ~zero on a normally-busy signal → a drop/outage (caught by the spike+drop operator).
Because the baseline is per hour, the band looks flat within a short (~30 min) chart — the whole window sits inside one hour. It steps up or down only where the window crosses an hour boundary. What matters isn't the shape but that the band sits at the right level for the current hour.
A monitor grouped by a high-cardinality dimension (per-IP, per-URL) has no band — those buckets aren't baselined — so its chart shows only the history line and the current value.
Worked example
Alert: Lưu lượng ngoài VN (≥ 50) — Geo Country monitor,
United States = 489.
This alarm is a fixed threshold (country ≠ Vietnam AND count ≥ 50), so 489 ≥ 50 fires
it. The attached chart shows why it matters: recent history hovers near zero, well inside the
grey band, then the current value spikes to 489 — far above the band. That gap tells you at
a glance this is a real surge, not routine noise. (A σ alarm would fire here too, since 489 is
many σ above the hour's mean.)
See also
- Alarms — build the rule and pick the operator.
- Notifications — where alerts are delivered.
- Incidents — the incident a fired alarm opens.