Business Usage
Business Usage reports per-domain egress volume and peak bandwidth, aggregated across every CDN vendor for the orchestrator. This is the billing-basis view.
Controls
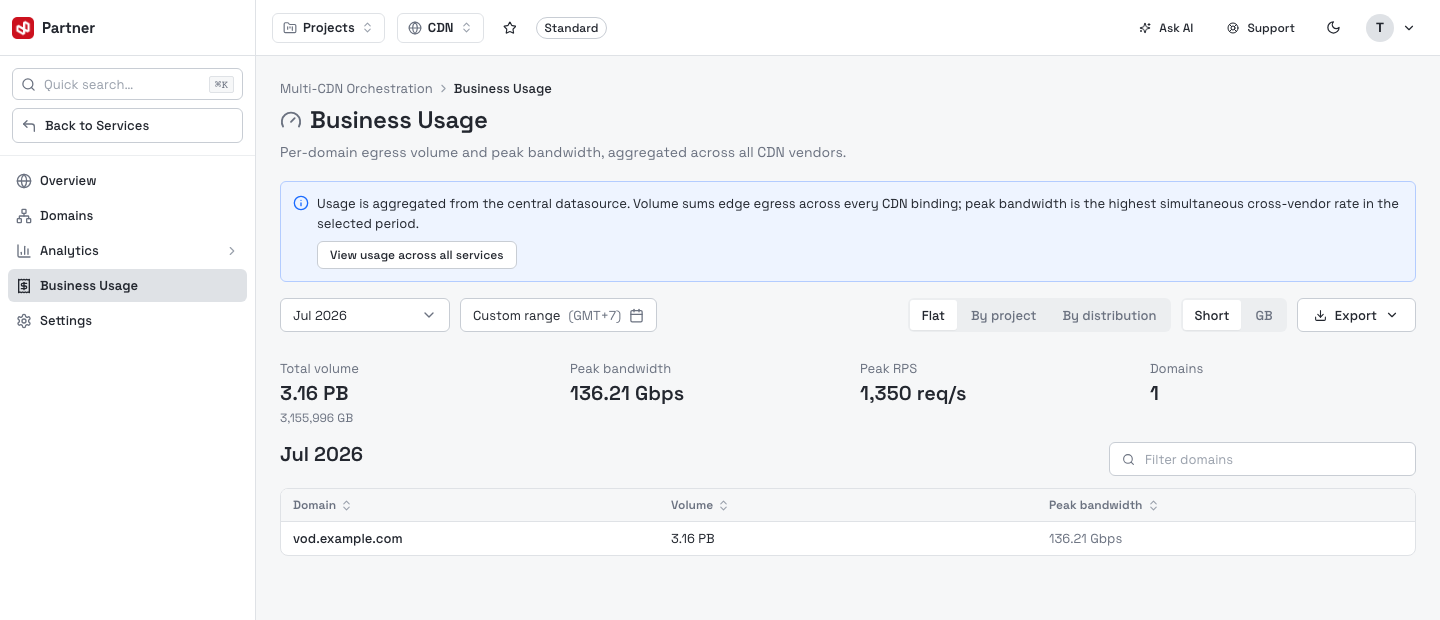
| Control | What it does |
|---|---|
| Month | Pick a billing month (last 12 months). |
| Custom range | Or choose a start/end date (GMT+7). |
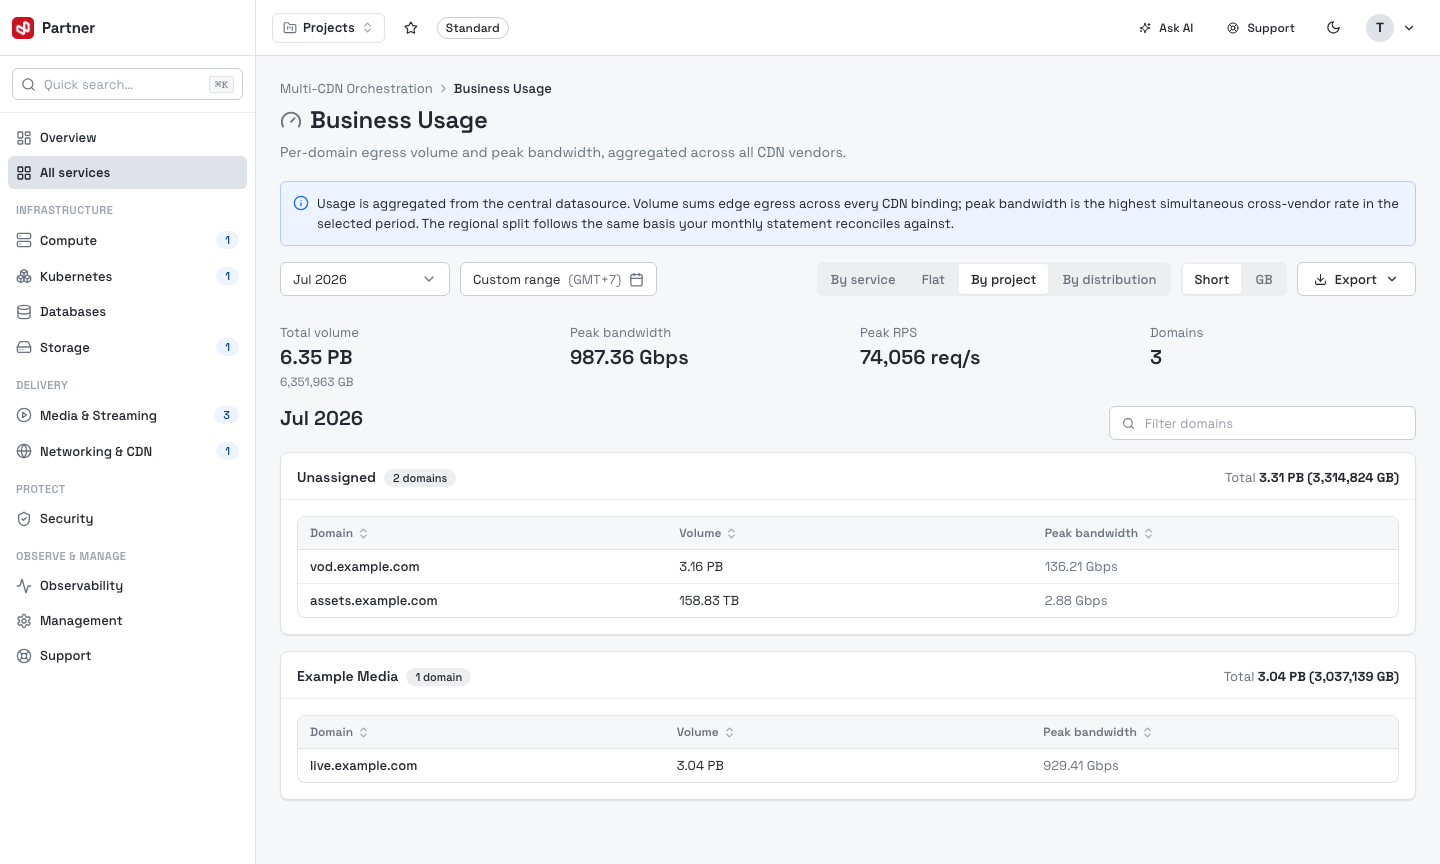
| Grouping | Flat, By project, or By distribution (region split). The org-wide view adds a By service grouping. |
| Unit | Short (human-readable) or GB (exact gigabytes). |
| Export | Download the current view as CSV, or request an Excel report. |
| Filter domains | Narrow the table by domain name. |
Figures
The KPI tiles summarize the selected period:
- Total volume — edge egress summed across every CDN binding (with the exact GB below).
- Peak bandwidth — the highest simultaneous cross-vendor rate in the period.
- Peak RPS — peak requests per second.
- Domains — how many domains contributed.
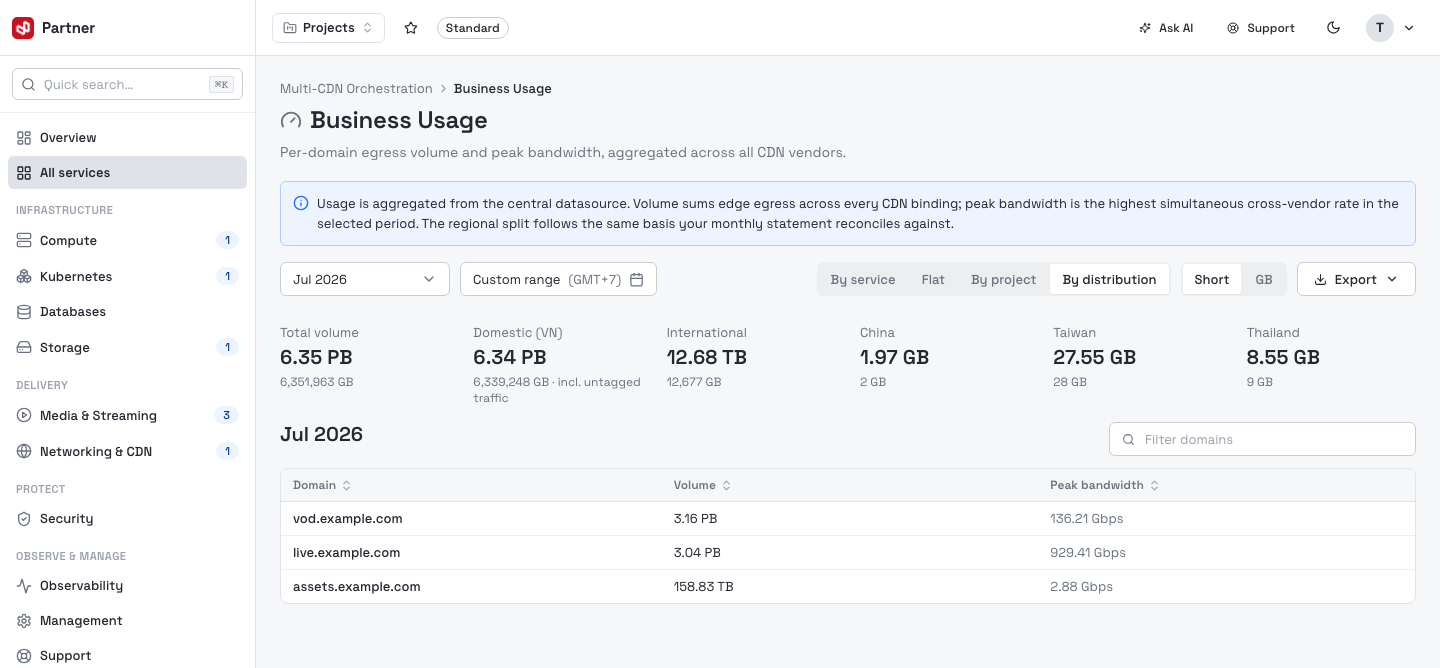
The table below lists each domain's Volume and Peak bandwidth. In By project or By service grouping, domains are nested under cards with per-group totals; in By distribution, a per-region breakdown (domestic VN, China, Taiwan, Thailand, other) sits above the table.
Grouping views
View usage across all services (top of the page) switches from this orchestrator to an organization-wide roll-up across every CDN service. The org-wide view unlocks the full grouping set:
By service — a card per CDN orchestrator, with its domains nested under each project and a per-service total.
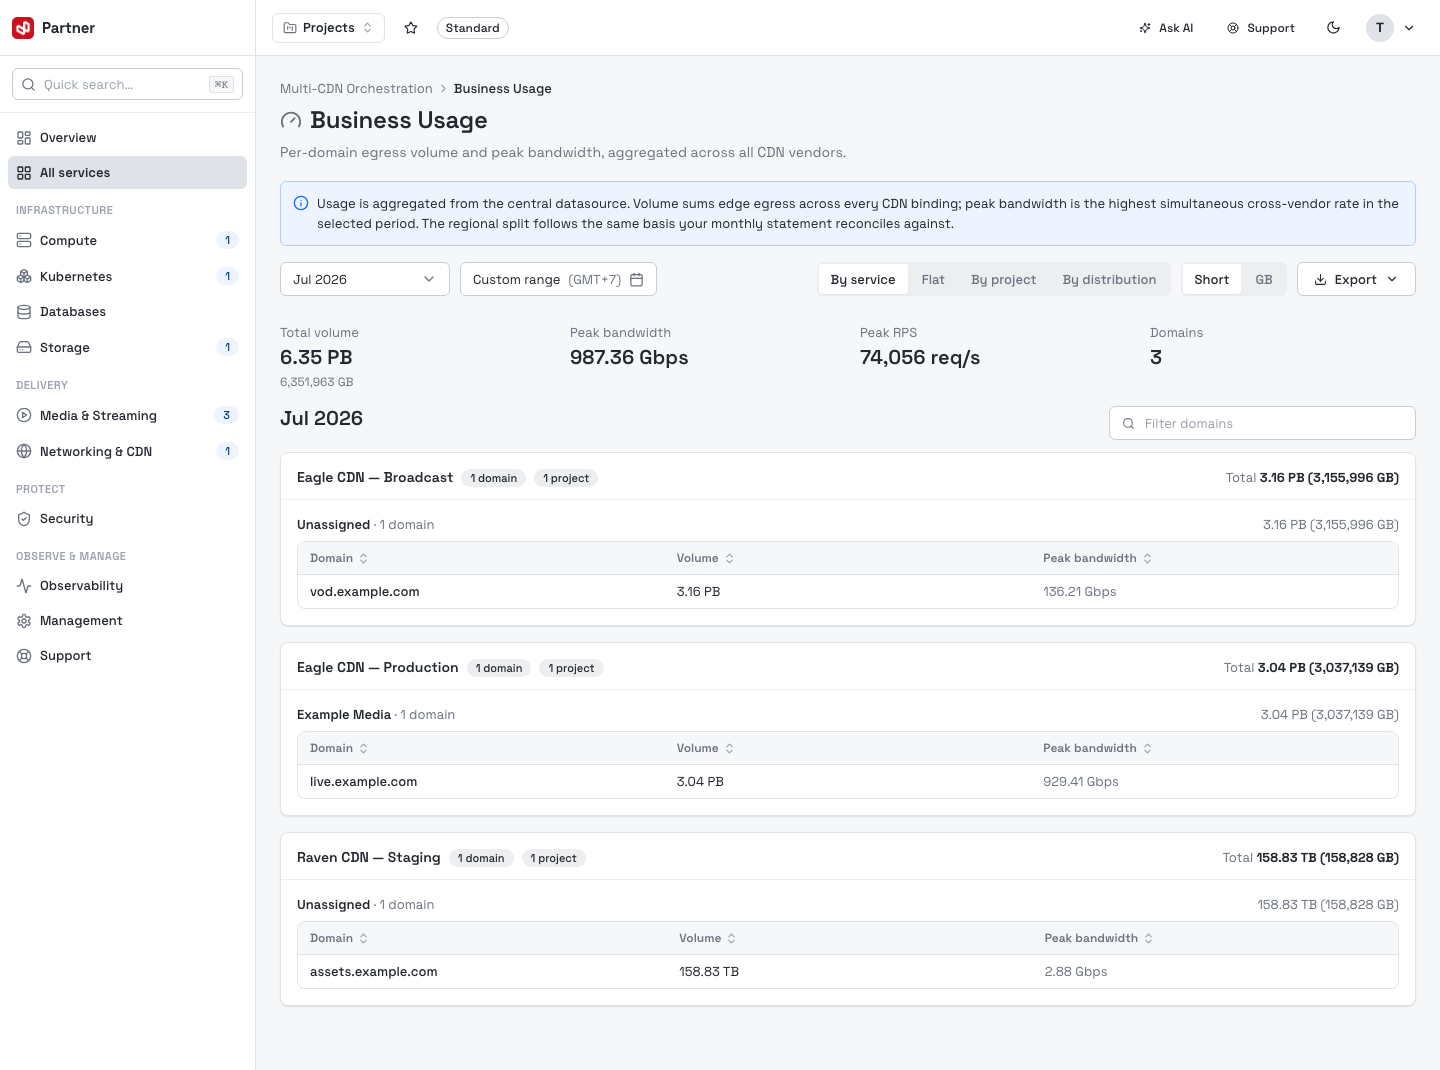
Flat — one row per domain across everything, sortable by volume.
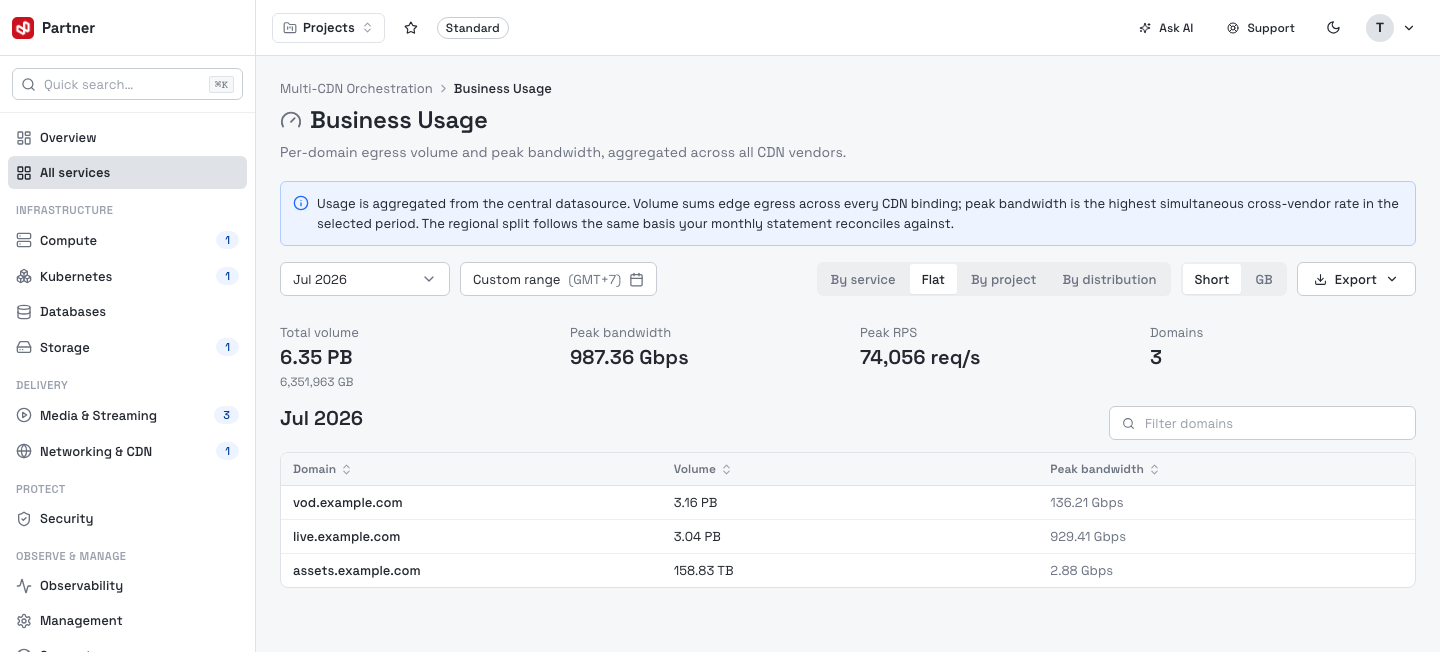
By project — domains grouped under their project (or Unassigned), each card totalled.
By distribution — the billing-basis region split (Domestic VN, International, China, Taiwan, Thailand) as KPI tiles above a flat domain table.
Export
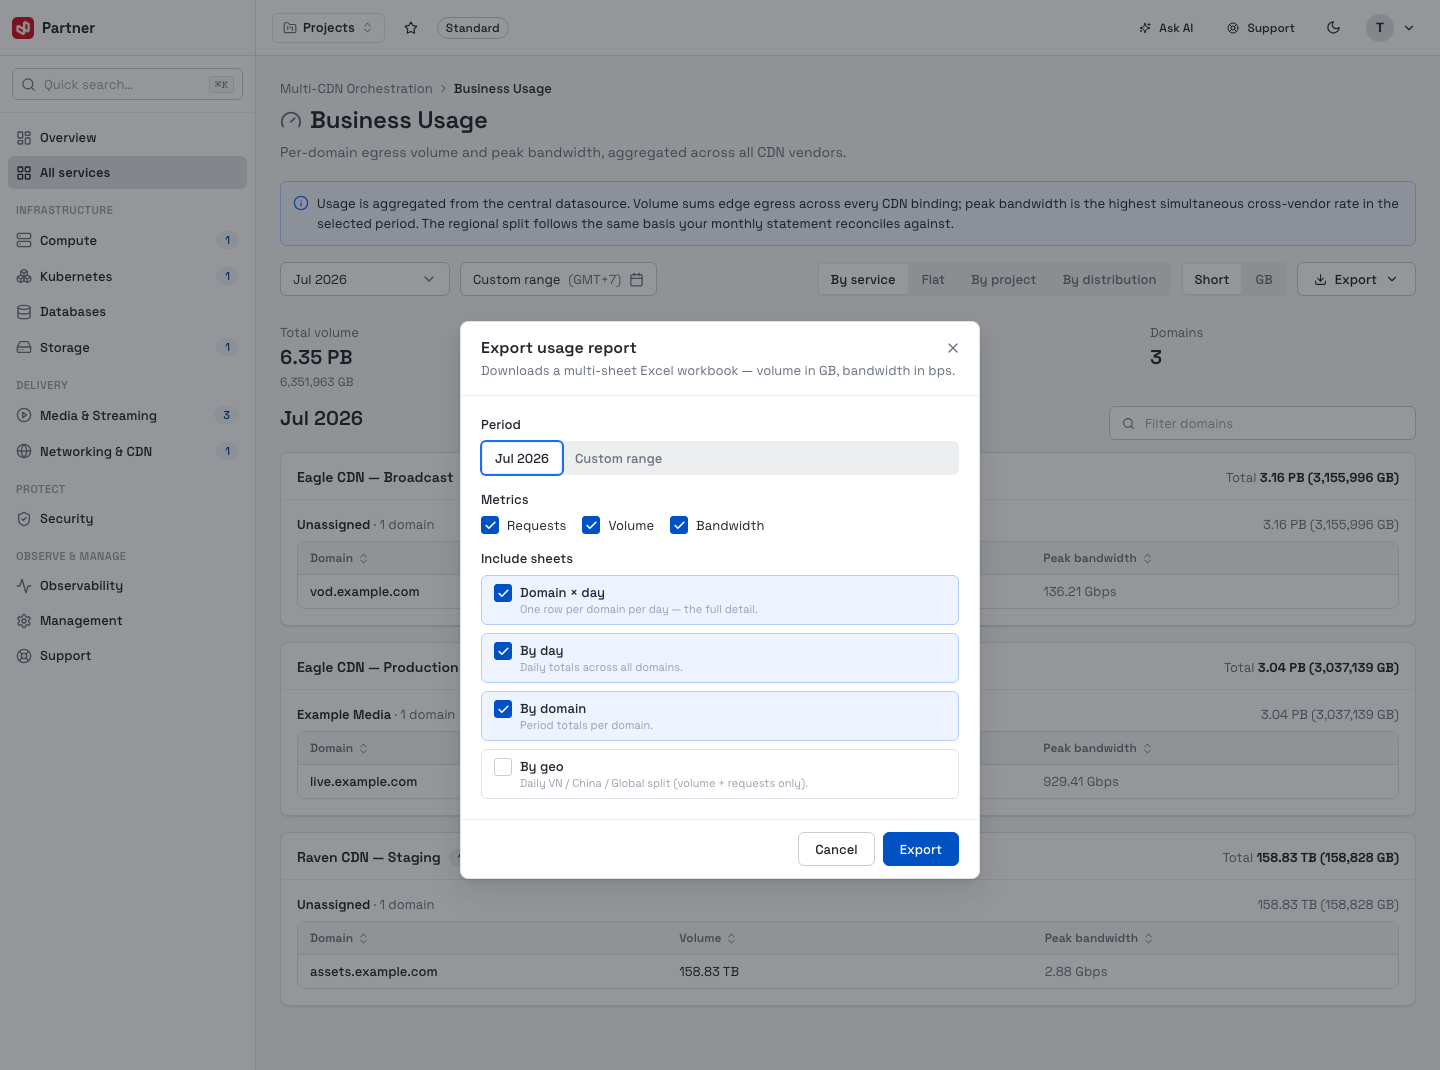
Export offers two outputs:
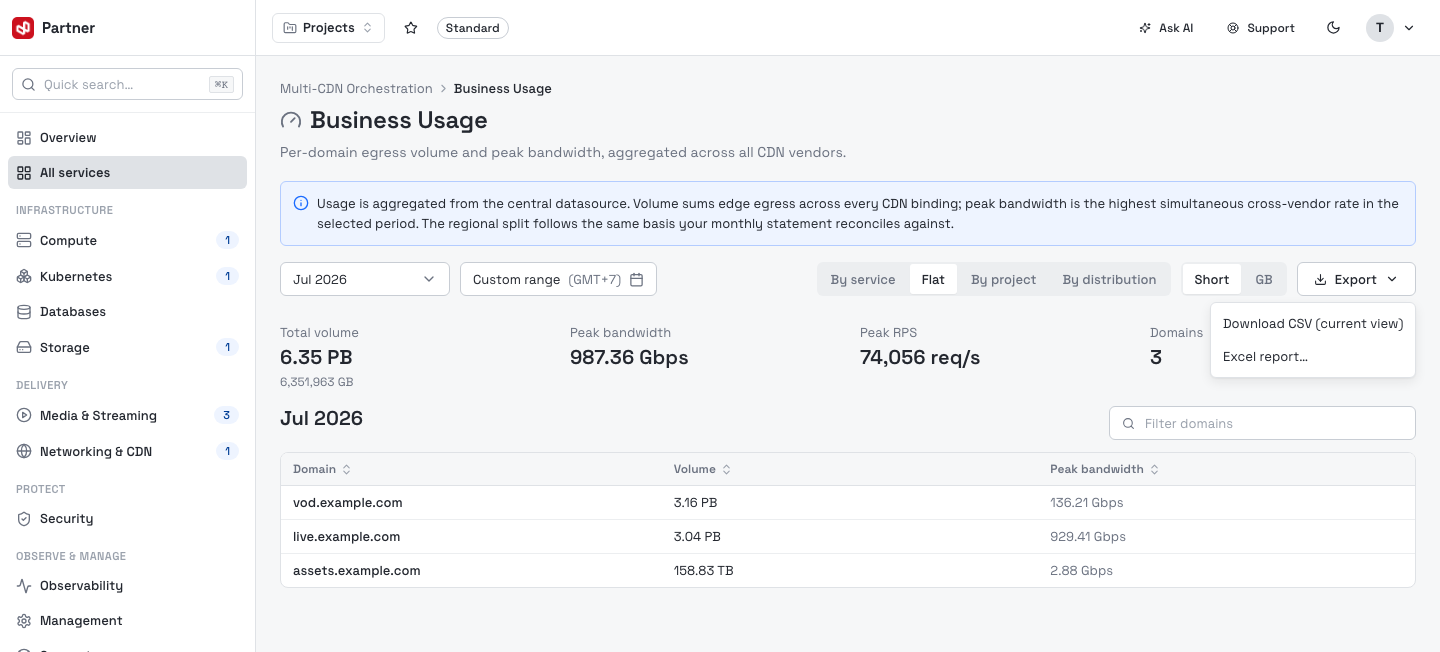
- Download CSV (current view) — the table as shown.
- Excel report… — a multi-sheet workbook (volume in GB, bandwidth in bps). Choose the period, the metrics (Requests / Volume / Bandwidth) and which sheets to include (Domain × day, By day, By domain, By geo).